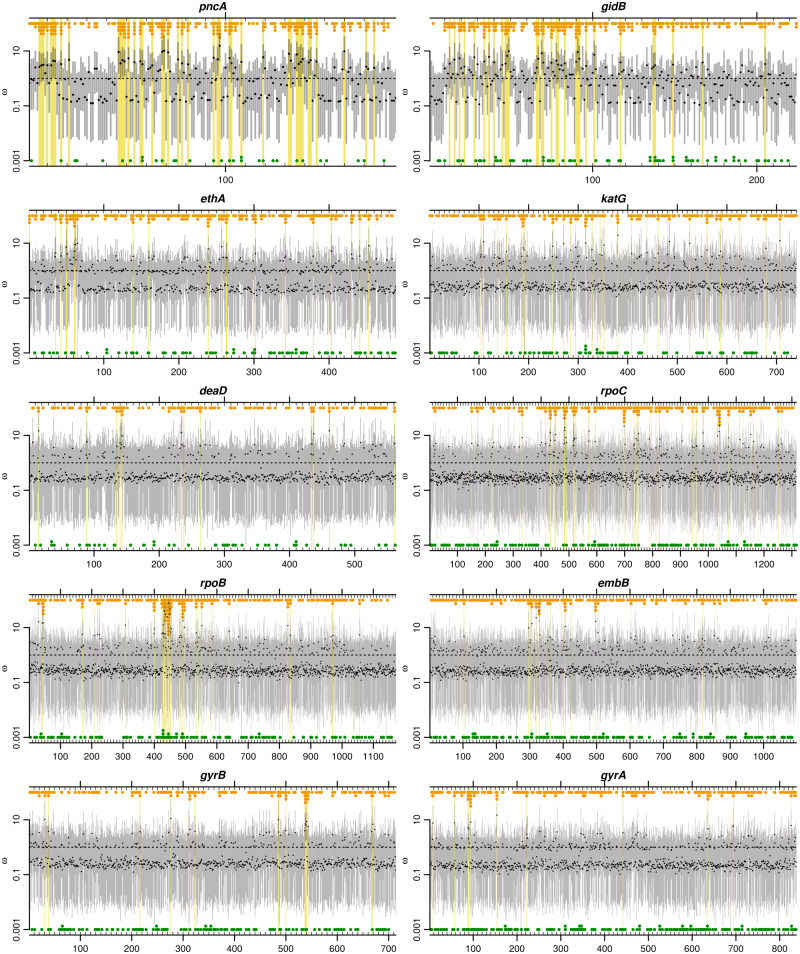
Fig. 4.
Evidence of positive selection in ten Mycobacterium tuberculosis genes across 10,209 genomes. Genes are ordered by the mean across codons, from highest (gidB) to lowest (gyrA). Point estimates (black points) and 95% credibility intervals (gray bars) for ω are shown across codons. Codons for which are highlighted with yellow boxes. Stacked points indicate the number of alleles that are nonsynonymous (orange) or synonymous (green) relative to the commonest allele.

