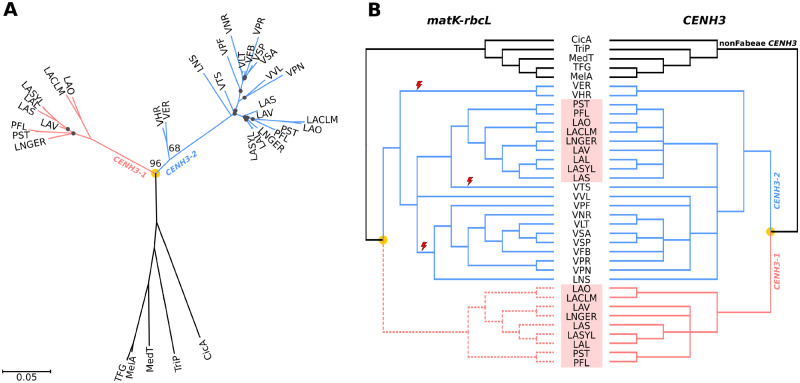
Fig. 5.
Phylogenetic trees of CENH3 sequences. (A) Phylogenetic tree inferred from the alignment of CENH3-coding sequences using the maximum likelihood method, excluding the INDEL region near the 5′ end (see supplementary fig. 5, Supplementary Material online). Bootstrap values are shown only for key nodes. Black dots indicate nodes with low bootstrap support (<50). The scale bar shows genetic distance. (B) Tanglegram showing comparison of the CENH3 tree from the panel (A) with the species tree inferred from matK–rbcL shown in figure 1A. Nodes with low bootstrap support (<50) were collapsed in both trees. The part of the matK–rbcL tree depicted by dashed lines was manually added to the tree to show comparison of phylogenies inferred from matK–rbcL and CENH3-1, and to allow the use of the matK–rbcL tree for analysis of positive selection in CENH3 genes. Red lightning symbols mark three independent losses of CENH3-1 genes. Pisum and Lathyrus species are highlighted by red rectangles. Orange dots indicate CENH3 duplication events.

