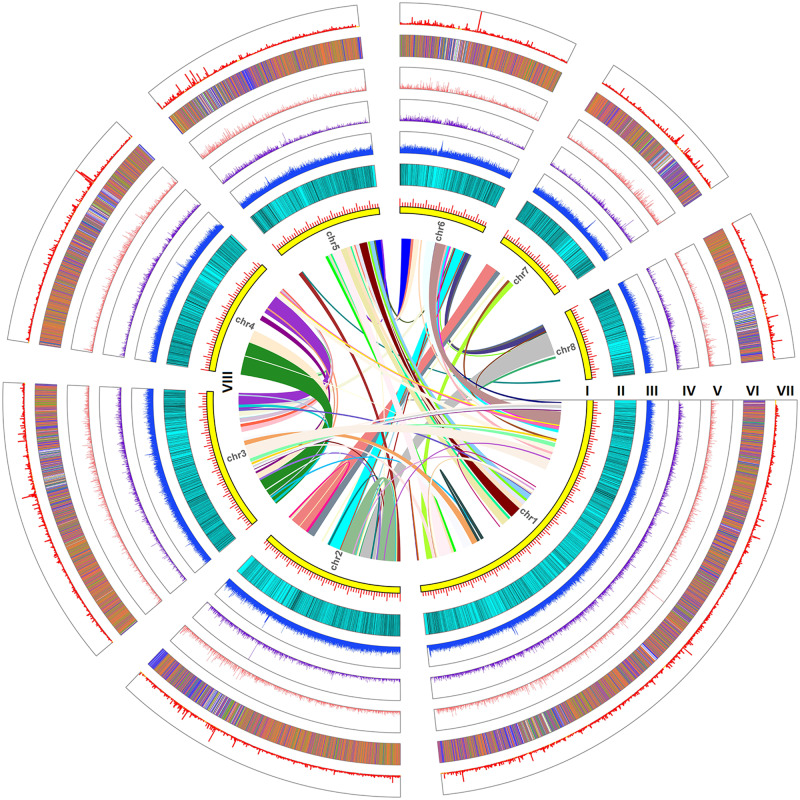
Fig. 1.
Circos plot of lotus genome assembly. From outside to inside rings: (I) size (Mb) of the assembly for each chromosome; (II) density distribution of genes; (III) density distribution of sRNA − TEs; (IV) density distribution of sRNA + TEs; (V) dot plot of nucleotide diversity of CDS for each gene; (VI) methylation level of genes and flanking regions; (VII) gene expression level (log-transformed FPKM value); and (VIII) syntenic paralogs are linked by colored lines.

