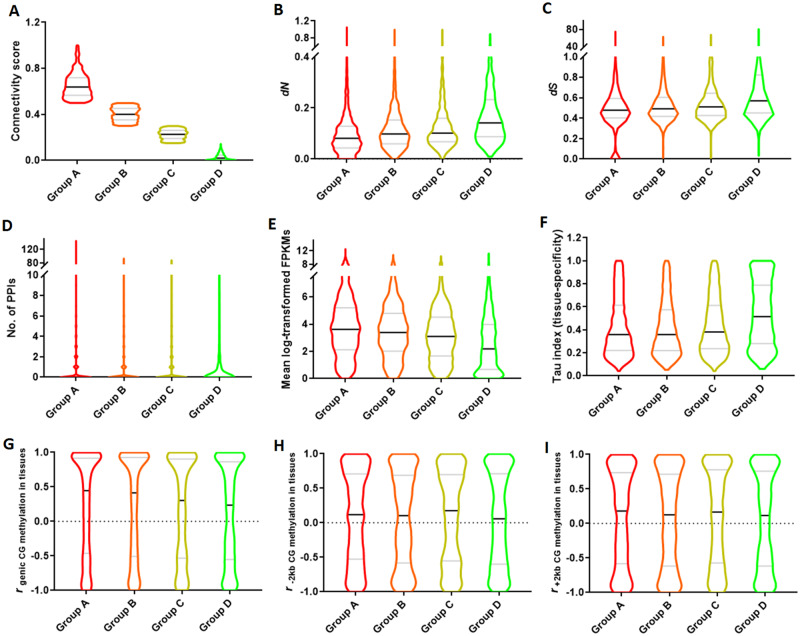
Fig. 4.
Violin plots of expression, functional, methylation, and evolutionary features of WGD-derived duplicate genes with different level of expression divergence (group A, group B, group C, and group D). (A) Connectivity score. (B) dN, nonsynonymous mutation. (C) dS, synonymous mutation. (D) The number of protein–protein interaction inferred from the closest orthologs in Arabidopsis. (E) The mean of log-transformed FPKM. (F) Tissue specificity index (based on Tau index). (G–I) r (correlation coefficient) of CG methylation levels in tissues between duplicates for gene body (G), upstream (H), and downstream region (I). Black line: median; gray line: quantile.

