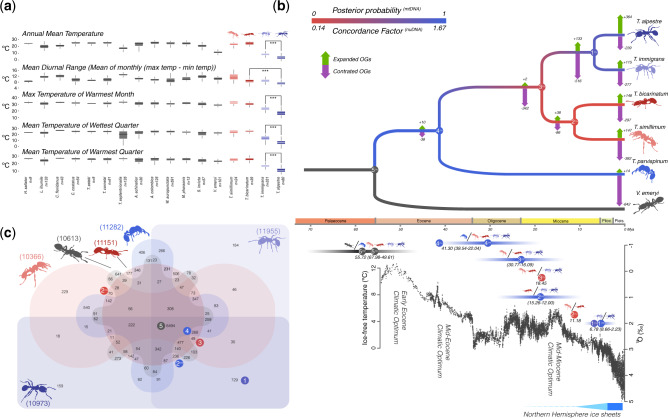
Fig. 1.
(a) Boxplots of the five bioclimatic variables significantly different for Tetramorium alpestre and 16 other ant species. (b) Dated Crematogastrini nuclear phylogeny (nuDNA) (above). Branch colors are based on the concordance factors of the nuDNA and the BI of the mtDNA. On each branch, the numbers of expanded (green arrows) or contracted (purple arrows) OGs are shown. Below the phylogeny, the global δ18O (‰), derived from analyses of two common and long-lived benthic taxa are given, Cibicidoides and Nuttallides, which reflect the global deep-sea oxygen and carbon isotope and thus the temperature (from Zachos et al. [2001]). Bars represent the 95% confidence interval (CI) of the BI analysis. The circles on top of the CI represent the timing of the phylogenetic splits for the nuDNA (Nnu) and mtDNA (Nmt) phylogenies, whereas the numbers within the circles represent the nodes in the phylogenetic tree (above). The same splits (i.e., nodes) are also represented by the ant diagrams and indicated bya /. (c) Venn diagram displaying overlap in orthologous genes in the five Tetramorium spp. + Vollenhovia emeryi (Crematogastrini). Numbers close to the species diagrams represent the total number of orthologous groups. Colored circles with numbers represent phylogenetic splits in the nuDNA (Nnu) and mitochondrial phylogenies in (b).

