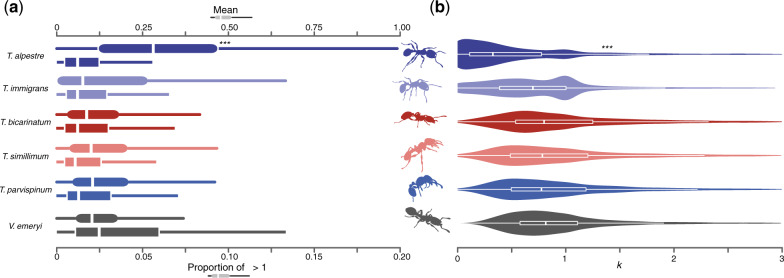
Fig. 2.
(a) Boxplots showing the distribution and median (vertical line) of mean ω (dN/dS) rates (square shapes) in terminal branches of Tetramorium spp. and Vollenhovia emeryi (Crematogastrini) in scOGs, and the proportion of genes for which ω is higher than one. (b) Boxplots overlapped by violin plots showing the distribution of k in Crematogastrini. The distribution in Tetramorium alpestre is bimodal as in Tetramorium immigrans, but with a much more skewed distribution toward 0 values. In both sections, asterisks indicate the degree of significance between T. alpestre and the other species (Wilcoxon rank-sum tests).

