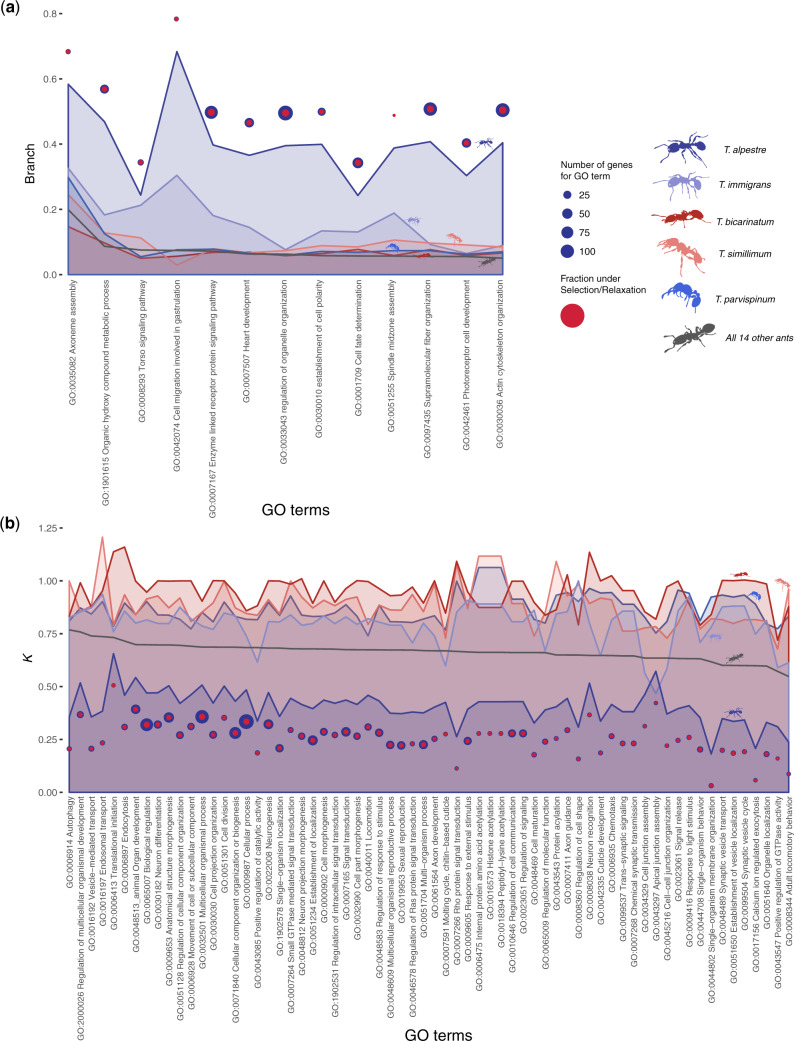
Fig. 3.
For each enriched GO term category, (a) the median values of ω and (b) k for genes enriching the specific category. Tetramorium spp. are color coded, the other 14 species, merged to obtain a background signal, are in gray. Blue circles are scOGs tested for each GO term, and red circles are scOGs returned as significant. Circle sizes are proportional to the number of genes. To be noted are the overall extremely higher values of ω and lower values of k in Tetramorium alpestre branches compared with those of the other species. Seldomly, also Tetramorium immigrans shows a few GO terms with high ω and low k values in particular, the Apical junction assembly (GO:0043297) shows an inverted trend between T. alpestre and T. immigrans.

