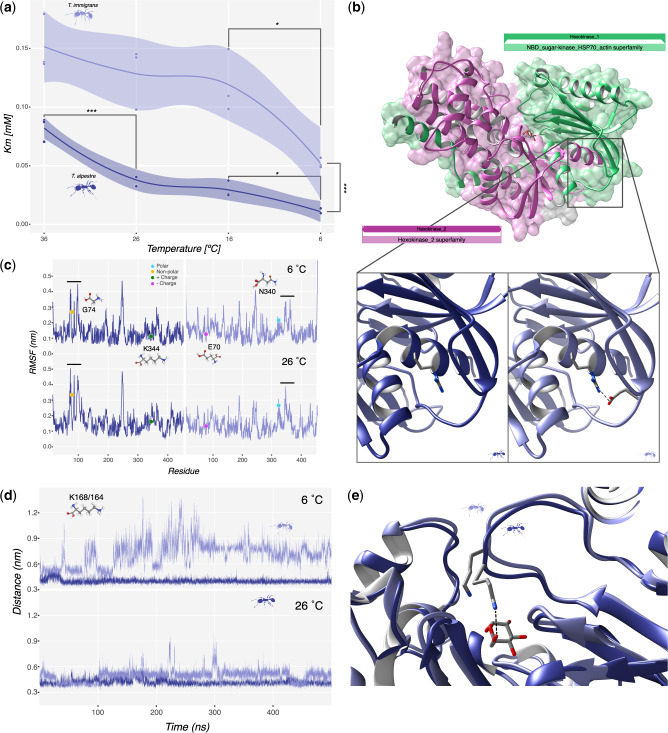
Fig. 4.
(a) Scatter plot of Km score across the temperature gradient in the two species, Tetramorium immigrans on top and Tetramorium alpestre on the bottom. Lines represent average values with confidence intervals. Significances: ***<0.001, **<0.001, and *<0.05. (b) Overview of the homology-modeled structure of Hex-T1 in T. alpestre showing the two Hexokinase domains, pfam00349 (green) and pfam03727 (pink). The lower panels show the location of TalpHex-T1G74 (left) and TimmHex-T1E70 (right) as well as the arginine residue that forms a salt bridge with E70 (dashed line). (c) Per-Residue Root Mean Square Fluctuation calculated along 500 ns trajectories carried out at 6 °C (upper panel) and 26 °C (lower panel) for TalpHex-T1 (left panel, blue line) and TimmHex-T1 (right panel, light blue line). The location of the residues found mutated between the two sequences are indicated. (d) Time evolution of the atomic distance between the center of mass of glucose and the lateral chain nitrogen atom of TalpHex-T1K168 (blue line) and TimmHex-T1K164 (light blue line) in the binding pocket calculated along the 500 ns trajectories carried out at 6°NVTC (upper panel) and 26 °C (lower panel). (e) Representative configurations extracted from the simulations at 26 °C showing the different orientation of TalpHex-T1K168 and TimmHex-T1K164, with the first one being the only one able to bind the glucose (dashed line).

