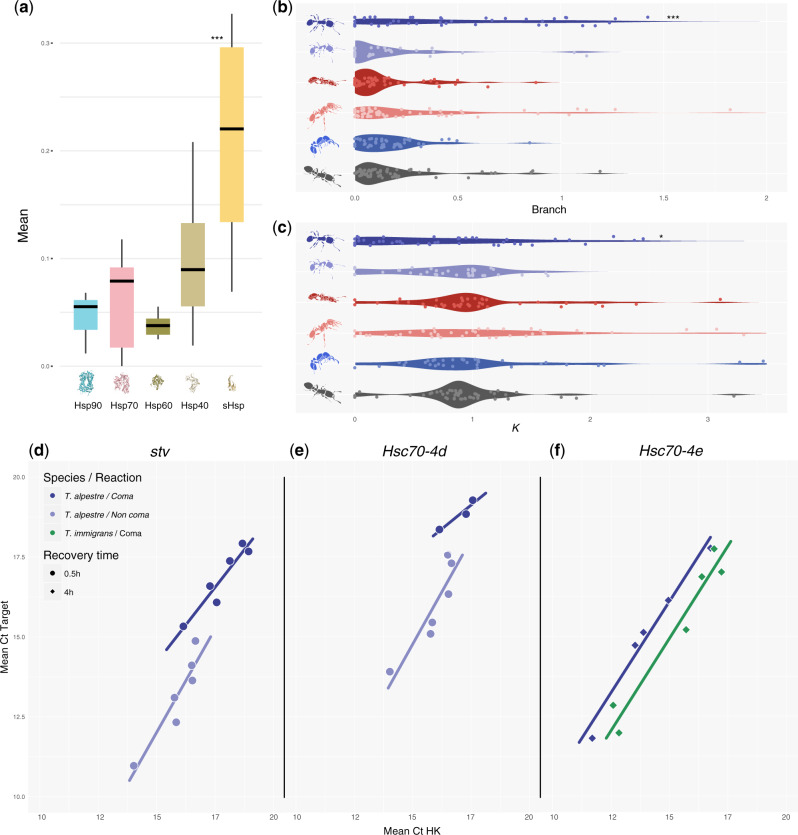
Fig. 5.
(a) Boxplots showing the distribution and median (horizontal black line) of mean ω (dN/dS) rates for each of the HSP subfamily. (b) Violin plot showing the distribution of the mean ω values and (c) k in the terminal branches of the Crematogastrini (from up to bottom: Tetramorium alpestre, T. immigrans, T. bicarinatum, T. simillimum, T. parvispinum, and Vollenhovia emeryi). (d–f) Scatter plots of target genes (stv, Hsc70-4d, and Hsc70-4e) versus housekeeping gene (HK) concentrations; concentrations given as total number of cycles minus cycle threshold (Ct) values, that is, higher values represent higher concentrations. Straight lines are linear regressions for the target gene against HK using the different recovery times separately. Only data and regression lines shown for which significant differences (P adjusted < 0.05) were identified using one-way ANCOVA within and among species (four comparisons per recovery time and gene) followed by correction for multiple test corrections (see supplementary figs. S20–S22, Supplementary Material online, for all data and regression lines).

