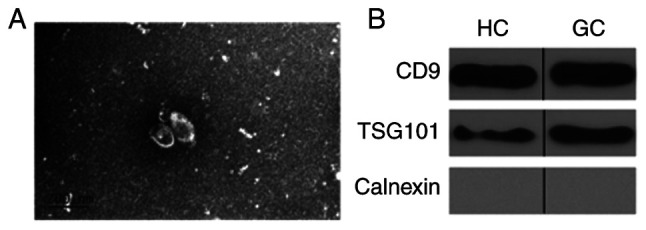
Figure 1.

Identification of exosomes. (A) Representative TEM images of exosomes isolated from. Scale bar, 200 nm. (B) Western blotting analysis of exosomes. CD9 and TSG101 were detected in exosome samples and calnexin was used as negative control. TEM, transmission electron microscopy; CD9, cluster of differentiation 9; TSG101, tumor susceptibility gene 101.
