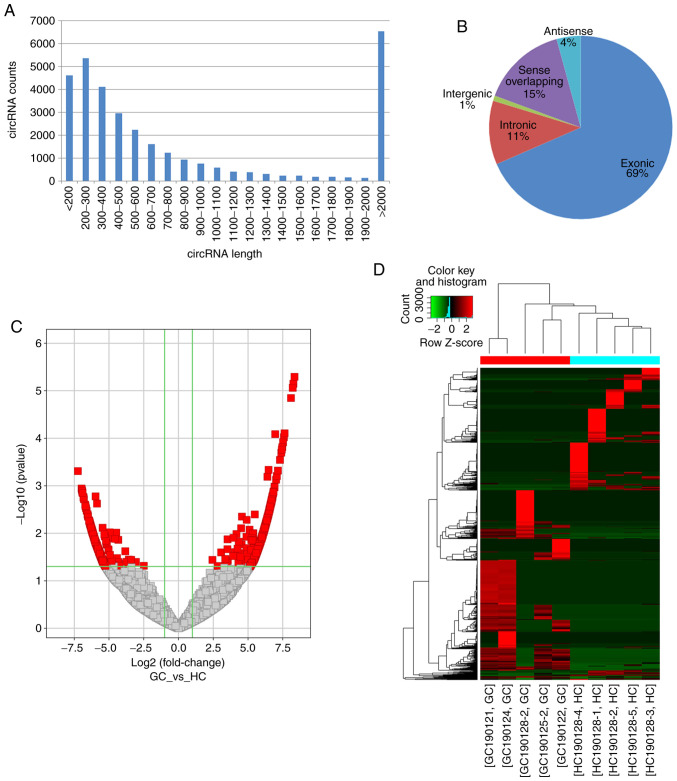
Figure 2.
Expression patterns circRNAs in plasma exosome from patients with GC and HC identified by high throughput RNA sequencing. (A) Length distribution of detected circRNAs. (B) Categories of circRNAs. (C) Volcano plot showing DE circRNAs between GC cases and HCs. Red dots [|log2FC| >1, -log10 (P-values) >1.3] represent significantly upregulated (log2FC >1) and downregulated (log2FC <-1) circRNAs. (D) Hierarchical cluster analysis and heatmap of DE circRNAs with a P-value<0.05 (n=5). Each row represents the expression level of a circRNA and each column represents an exosome sample. Pseudo-colors indicate expression levels from low to high (green to red). circRNA, circular RNA; FC, fold change; GC, gastric cancer; HC, healthy control; DE, differentially expressed.

