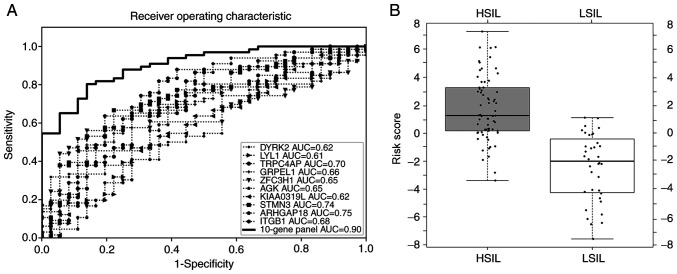
Figure 2.
Model evaluation with ROC curve and box-whisker plot. (A) ROC curve for candidate genes of the training set. (B) Box-whisker plot to display the logistic regression scores in HSILs and LSILs in the training set. ROC, receiver operating characteristic; HSIL, high-grade squamous intraepithelial lesion; LSIL, low-grade SIL; AUC, area under curve.

