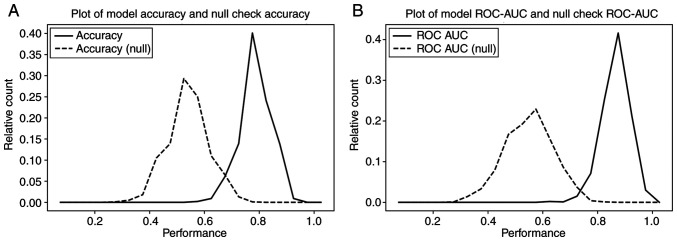
Figure 3.
Two-fold cross-validation results over 1,000 iterations based on the known HSIL/LSIL disease status (true set, solid line) and re-assigned disease status (null set, dashed line) of the samples. This chart displays the distributions of (A) accuracy and (B) AUC ROC values over the 1,000 iterations, in which the model accuracy and ROC in the null set analysis were much lower than that in the known HSIL/LSIL status analysis. ROC, receiver operating characteristic; HSIL, high-grade squamous intraepithelial lesion; LSIL, low-grade SIL; AUC, area under curve.

