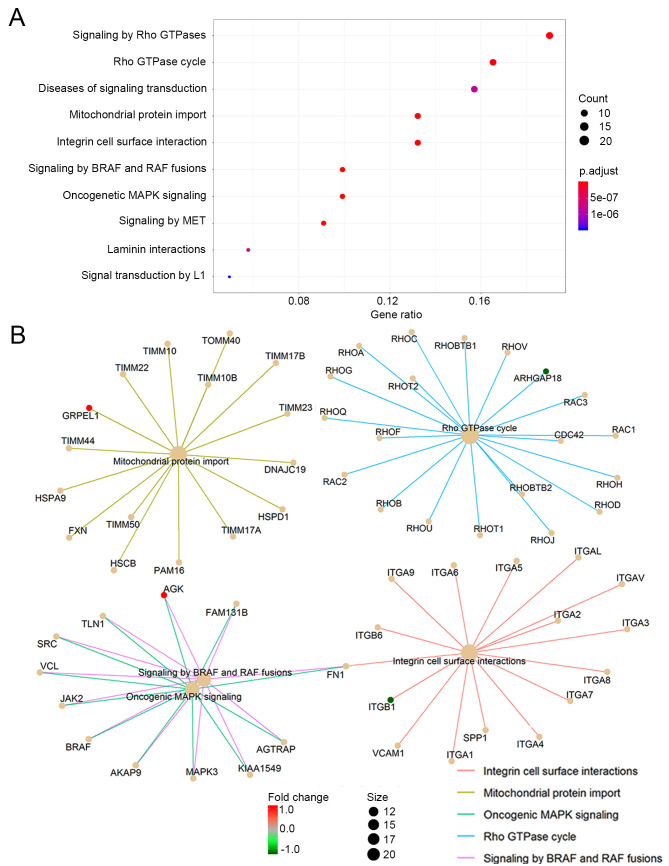
Figure 5.
Reactome pathway analysis of the 10 candidate genes. (A) The top 10 significantly enriched Reactome pathways. (B) The top 5 significantly enriched Reactome pathways and their associated genes (red, upregulated candidate genes; green, downregulated candidate genes; light orange, genes corresponding to the proteins interacting with the candidate genes).

