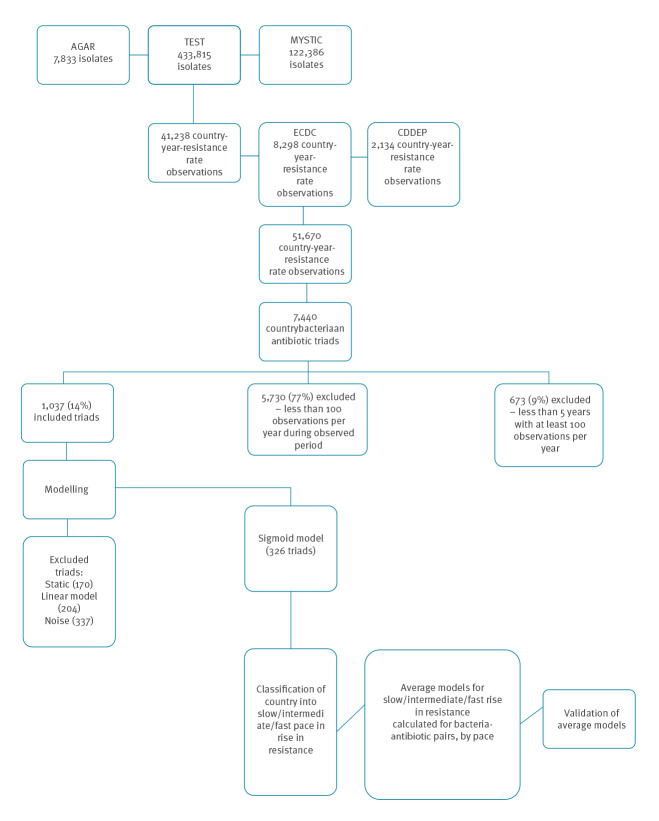
Figure 1.
Data selection flowchart and overview of analysis of models to predict the spread of antimicrobial resistance, 1997–2015, 75 countries
AGAR: Australian Group on Antimicrobial Resistance; CDDEP: Center for Disease Dynamics, Economics and Policy; ECDC: European Centre for Disease Prevention and Control; MYSTIC: Meropenem Yearly Susceptibility Test Information Collection.
Number of countries covered by area: Europe (n = 34), Asia (n = 17), South America: (n = 6), Africa (n = 6), Central America (n = 6), North America (n = 2), Oceania (n = 2), Caribbean (n = 2).

