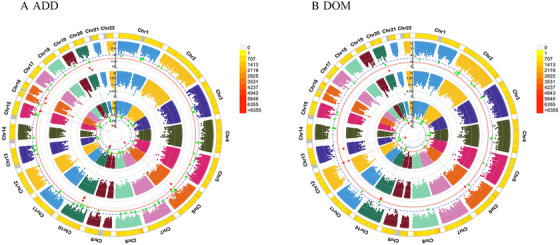
Figure 1.

Genomic regions interacting with HSV‐1 for PHQ score
Note. From the center, the first circos depicts the –log10 P‐values of each variant due to double exposure, that is, the effect of both SNP allele and HSV‐1. The second circos illustrates the effect of HSV‐1. The third circos depicts the effect of the SNP allele. The fourth circos shows chromosome density. Red plots represent the P‐value < 5 × 10⁻⁷ and green plots represent P‐value < 1 × 10⁻⁵. The plots were generated using the “CMplot” R script (https://github.com/YinLiLin/R-CMplot).
Abbreviations: ADD, additive effect; DOM, dominance deviation.
