-
A
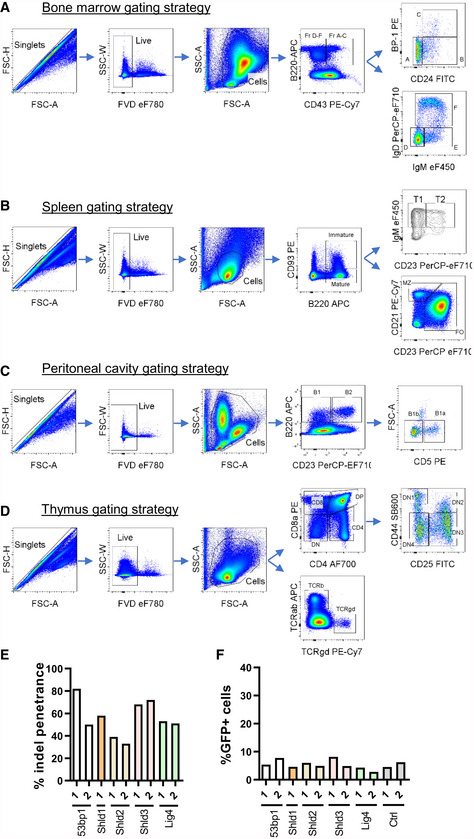
Gating strategies used to quantitate Hardy fractions A‐F of progenitor B‐cells in bone marrows of WT and Shld2
−/− mice.
-
B
Gating strategies used to quantitate immature, mature, T1, T2, MZ, and FO B‐cell populations in the spleen of WT and Shld2
−/− mice.
-
C
Gating strategies used to quantitate B1, B2, B1a, and B1b populations in the peritoneal cavity of WT and Shld2
−/− mice.
-
D
Gating strategies used to quantitate various thymocyte populations in WT and Shld2
−/− mice.
-
E
Insertion–deletion (indel) penetrance was measured by TIDE sequencing for the lentiCRISPRv2 constructs expressing the indicated sgRNAs targeting the 53bp1, Shld1, Shld2, Shld3, and Lig4 genes.
-
F
Baseline GFP frequency of bulk gene‐edited A70.2 cells prior to imatinib stimulation (Fig
1F).

