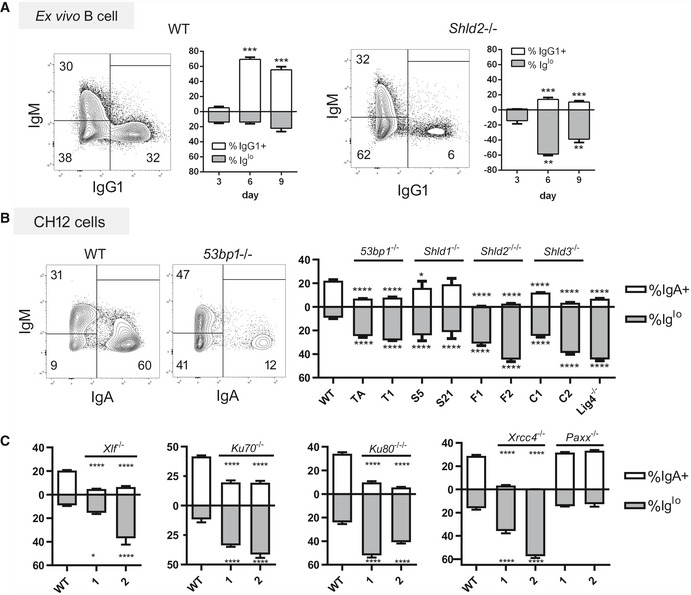
Figure 3. SHLD2‐deficient B‐cells and B‐cells deficient in other NHEJ factors exhibit an Iglo population upon CSR induction.

-
AWT and Shld2 −/− B‐cells were purified from spleens and stimulated with LPS + IL4 and examined for IgM and IgG1 expression 3, 6, and 9 days post‐stimulation by flow cytometry. Representative plots are shown for both WT and Shld2 −/− B‐cells 6 days post‐stimulation. The graph plots show proportion of IgG1+ and Iglo cells, mean ± SD from 6 biological replicates; **P ≤ 0.01, ***P ≤ 0.001, two‐way ANOVA with post hoc Dunnett's test.
-
BWT CH12 cells, as well as two each of 53BP1‐, SHLD1‐, SHLD2‐, and SHLD3‐deficient clones generated previously (Noordermeer et al, 2018), as well as a LIG4‐deficient CH12 clone, were subjected to CSR induction with the CIT cocktail and measured for both IgM and IgA expression by flow cytometry. Representative flow plots for WT and 53bp1 −/− CH12 cells are shown at day 3 post‐CIT stimulation. The graph plots show proportion of IgA+ and Iglo CH12 cells, mean ± SD from 3 biological replicates; *P ≤ 0.05, ****P ≤ 0.0001, two‐way ANOVA with post hoc Dunnett's test. The letters below the x‐axis represent the clone codes for the 53BP1‐, SHLD1‐, SHLD2‐, and SHLD3‐deficient CH12 clones. One LIG4‐deficient CH12 clone was also used.
-
CThe Xlf, Ku70, Ku80, Xrcc4, and Paxx genes were knocked out in CH12 cells by CRISPR, and two independent clones each were analyzed as in Fig 3B with mean ± 3 biological replicates; *P ≤ 0.05, ****P ≤ 0.0001, two‐way ANOVA with post hoc Dunnett's test.
