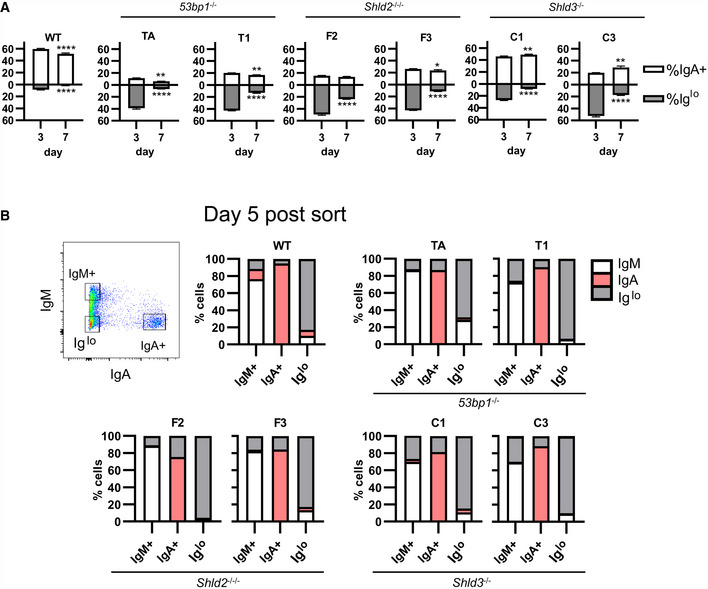
WT and two independent clones each of
53bp1
−/−,
Shld2
−/−/−, and
Shld3
−/− CH12 clones were stimulated with CIT for 3 days. The IgM
+, IgA
+, and Ig
lo populations were sorted and reanalyzed for expression of IgM and IgA 5 days post‐sort as well as 12 days post‐sort (see Fig
EV4B). Shown on bar graphs are sorted IgM
+, IgA
+, and Ig
lo populations (each column, 1 technical replicate) from WT and mutant CH12 clones, and the percent of cells expressing IgM, IgA, or low for both isotypes (Ig
lo) after 5 days of culture post‐sort. A representative flow plot of
53bp1
−/− CH12 3 days post‐CIT treatment is shown.