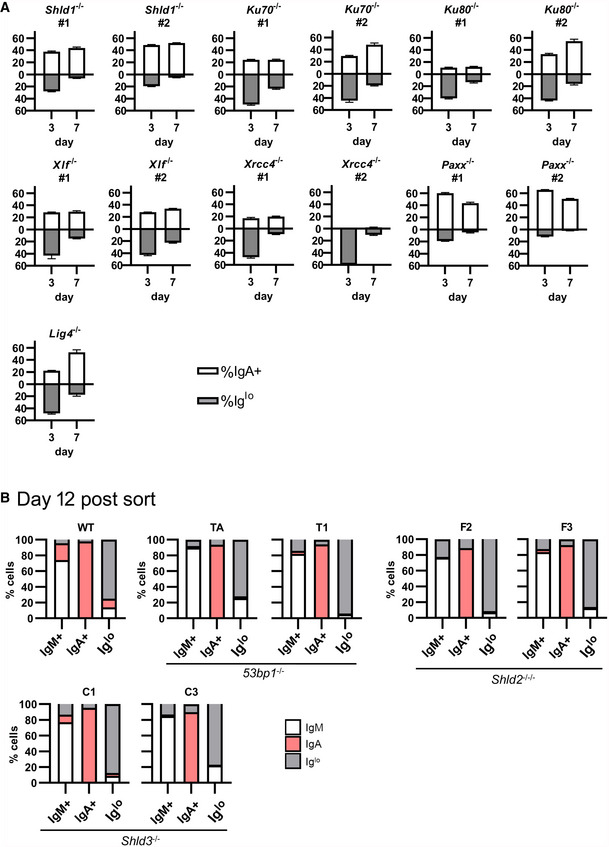
Figure EV4. CSR induces a permanent loss of Ig expression in CH12 cells.

-
AThe indicated NHEJ‐mutant CH12 clones were stimulated with CIT and analyzed by flow cytometry for IgM and IgA expression at days 3 and 7; mean ± SD of 3 biological replicates.
-
BWT, 53bp1 −/−, Shld2 −/−/−, and Shld3 −/− CH12 clones were stimulated with CIT for 3 days. The IgM+, IgA+, and Iglo populations were sorted and reanalyzed for expression of IgM and IgA 12 days post‐sort. Shown on bar graphs are sorted IgM+, IgA+, and Iglo populations (each column, 1 technical replicate) from WT and mutant CH12 clones, and the percent of cells expressing IgM, IgA, or low for both isotypes (Iglo) after 12 days of culture post‐sort.
