
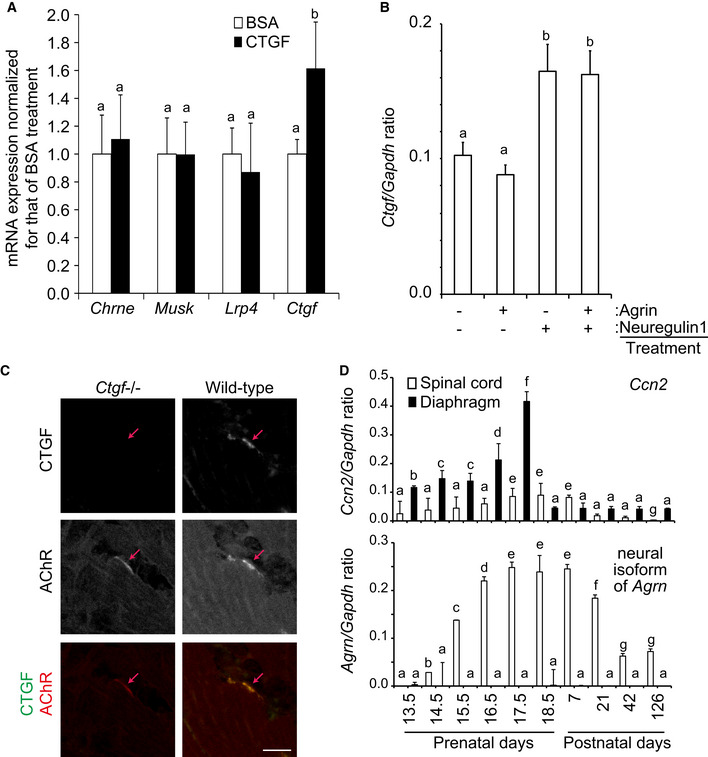
Figure 4. Ctgf is enriched at the neuromuscular junction.
-
A, B(A) Quantitative RT–PCR of Chrne, Musk, Lrp4, and Ctgf in C2C12 myotubes treated with 10 ng/ml BSA or recombinant human CTGF. (B) Quantitative RT–PCR of Ctgf in C2C12 myotubes treated with indicated combinations of 10 ng/ml agrin and/or 10 ng/ml neuregulin‐1. Mean and SD (n = 3 mice) are indicated. P‐value < 0.05 by two‐way repeated measures ANOVA (A) and one‐way ANOVA (B). P < 0.05 by post hoc Tukey test is indicated by a single letter representing each group.
-
CLocalizations of CTGF and AChR in a representative cross section of the lower limb muscle at E18.5. Co‐localization of AChR (red) and CTGF (green) is indicated in the merged images. Red arrow points to an AChR cluster. Scale bar = 20 μm.
-
DQuantitative RT–PCR of Ctgf and neural Agrn in the spinal cord and the diaphragm in mouse. Mean and SD (n = 3 mice) are indicated. P‐value < 0.05 by two‐way repeated measures ANOVA. P < 0.05 by post hoc Tukey test is indicated by a single letter representing each group.