
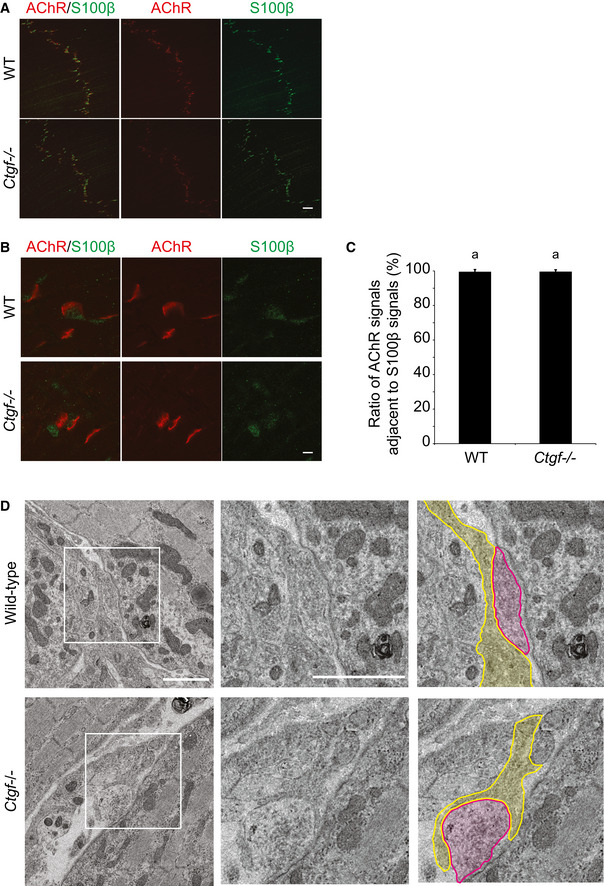
Figure EV4. Ctgf −/− diaphragm shows no significant differences in number of Schwann cells at the NMJ .
-
A–CRepresentative low (A) and high (B) magnification images of the whole‐mount left diaphragms at E18.5 stained for S100β (green) and AChR (α‐bungarotoxin, red). (C) Blinded morphometry to examine the ratio of AChR signals adjacent to S100β signals. Mean and SD (n = 30 NMJs in 5 left diaphragms) are indicated. Scale bar = 20 μm (A) and 2 μm (B). P‐value > 0.05 by Student's t‐test. Lack of statistical difference is indicated by a single letter “a.”
-
DRepresentative electron micrographs of the NMJs in the diaphragm of wild‐type and Ctgf −/− mice at embryonic day (E) 18.5. Nerve terminal (red) is juxtaposed with Schwann cells (yellow). Scale bar = 1 μm.