-
A, B
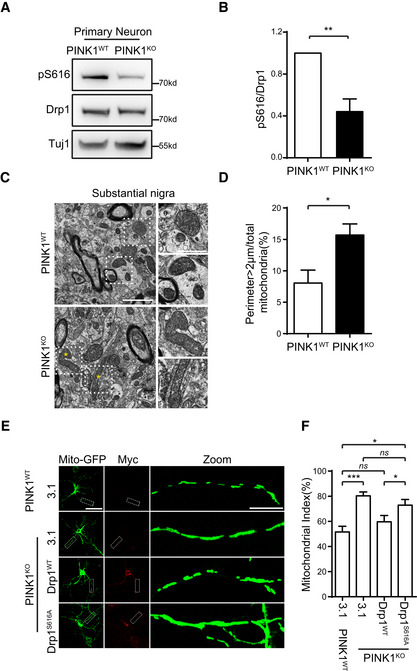
Decreased Drp1S616 phosphorylation in PINK1‐null primary neurons. Lysates of DIV6 neurons generated from PINK1KO and PINK1WT control mice were immune‐detected with antibodies against either phospho (Ser616)‐Drp1 (pS616) or Drp1. Tuj1 was detected as a loading control (A). Quantitation of pS616/Drp1 for each experiment is shown (B). Student's test. **P < 0.01. Data were presented as mean ± SEM of three independent experiments.
-
C, D
TEM analysis of mitochondria in mouse substantial nigra. Sections of substantial nigra from 18‐month‐old PINK1KO and PINK1WT control mice were analyzed under TEM (C, left panels, scale bar = 2 μm). Amplified images of mitochondria from dot line frames gated region are shown (C, right panels, scale bar = 1 μm). Asterisks indicate abnormal elongated mitochondria. A quantitative analysis of mitochondria with perimeter > 2 μm is shown (D). Over 300 identifiable mitochondria (cristae and/or double membrane) per mice were randomly and blindly selected for perimeter measurement. Student's test. *P < 0.05. Data were presented as mean ± SEM of three independent experiments.
-
E, F
Overexpression of Drp1WT, but not phosphorylation mutant Drp1S616A, suppresses mitochondrial fusion in dendrites of PINK1KO primary neurons. (E) DIV4 neurons generated from PINK1WT control or PINK1KO mice were cotransfected mito‐GFP with either pcDNA3.1 (3.1) or Drp1WT or Drp1S616A. Neurons were immunodetected with an antibody against myc‐tag (Myc) (red, to detect exogenous Drp1). Mito‐GFP: green, to detect mitochondria. Representative images were shown, scale bar = 25 μm. Magnified dendritic shafts gated by a dot line frame are shown (Zoom, right panels, scale bar = 5 μm) (F). Quantification of mito index in dendrites of neurons from experiments of (E). Ten neurons were randomly selected and analyzed in each experiment. One‐way ANOVA followed with Tukey's test. *P < 0.05, ***P < 0.001, ns: no significance. Data were presented as mean ± SEM of three independent experiments.

