-
A–C
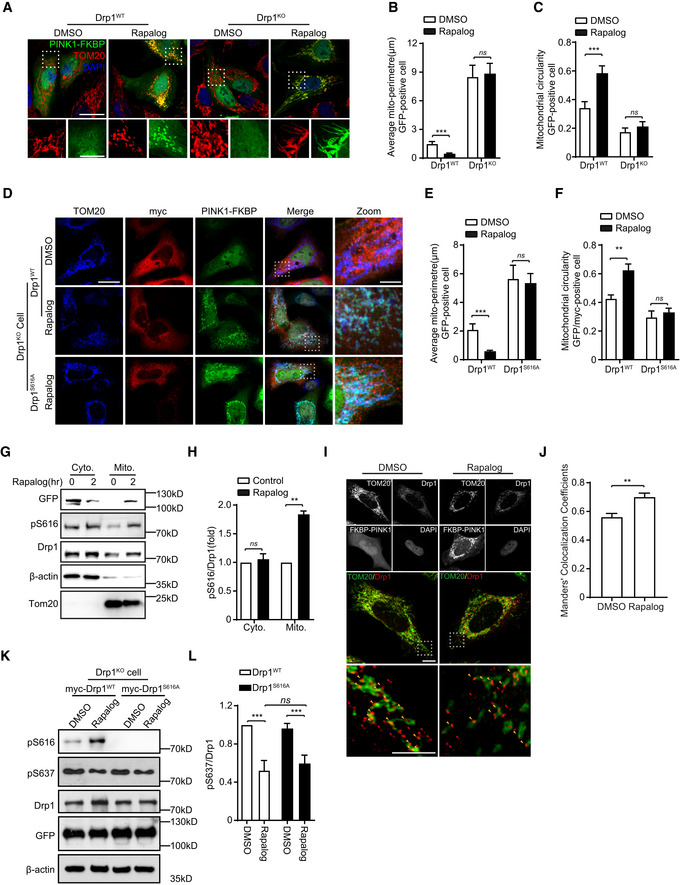
Drp1 is required for mitochondrial fission induced by PINK1. Drp1‐null HeLa cells (Drp1KO) and their wild‐type controls (Drp1WT) were cotransfected Δ110‐PINK1‐GFP‐FKBP with FRB‐MTS. Cells were induced with 250 nM rapalog for 2 h to activate PINK1 kinase, followed by immunodetecting mitochondria (TOM20, red) and Δ110‐PINK1‐GFP‐FKBP/FRB‐MTS (Δ110‐PINK1, green). Nuclei were labeled with DAPI (blue). Cells treated with solvent (DMSO) were used as a treatment control. Representative images were shown (A, upper panel, scale bar = 25 μm). Higher magnification images are also included (A, lower panel, scale bar = 10 μm). Mitochondrial morphology in different transfections was quantified. (B, C). Student's test. ***P < 0.001, ns: no significance. Data were presented as mean ± SEM of three independent experiments. For each condition, > 100 cells were analyzed.
-
D–F
Drp1S616 phosphorylation is required for mitochondrial fission induced by PINK1. Drp1KO HeLa cells were cotransfected Δ110‐PINK1‐GFP‐FKBP/FRB‐MTS with either a plasmid encoding Drp1WT or a Drp1 dephosphorylation‐mimic mutant Drp1S616A. Cells were treated with 250 nM rapalog for 2 h to activate PINK1 kinase, followed by immunodetecting mitochondria (TOM20, blue), exogenous Drp1 (myc, red), Δ110‐PINK1‐GFP‐FKBP/FRB‐MTS (PINK1‐FKBP, green). Cells treated with solvent (DMSO) were used as a treatment control. Representative images were shown, scale bar = 25 μm (D). Higher magnification images are also included (D, Zoom, scale bar = 5 μm). Mitochondrial morphology in different transfections was quantified (E, F). Student's test. **P < 0.01, ***P < 0.001, ns: no significance. Data were presented as mean ± SEM of three independent experiments. For each condition, > 100 cells were analyzed.
-
G, H
Targeting PINK1 kinase domain to OMM increases mitochondrial localization of phosphorylated Drp1S616. HEK293 cells cotransfected FRB‐MTS with Δ110‐PINK1‐GFP‐FKBP were treated with 250 nM rapalog (Rapalog). After 2 h treatment, cytosol protein (cyto) and mitochondria (Mito) were fractionated and immunoblotted with antibodies against either phospho (Ser616)‐Drp1 (pS616), Drp1 (Drp1), or GFP (PINK1). Tom20 and β‐actin were detected as mitochondrial loading control and cytosol loading control, respectively (G). Quantitation of pS616/Drp1 in various conditions was shown (H). Student's test. **P < 0.01, ns: no significance. Data were presented as mean ± SEM of three independent experiments.
-
I, J
Targeting PINK1 kinase domain to the OMM increases mitochondrial localization of Drp1. HeLa cells cotransfected FRB‐MTS with Δ110‐PINK1‐GFP‐FKBP (FKBP‐PINK1) were treated with 250 nM rapalog (Rapalog) for 2 h to activate PINK1 kinase. Cells treated with solvent (DMSO) were included as a control. Cells were immunostained with antibodies against either Tom20, Drp1, and GFP (PINK1‐FKBP). Representative images were shown, scale bar = 2 μm (I). Higher magnification images from gated box are shown (bottom panels). Arrows indicate Drp1 puncta. Mitochondria‐associated (yellow) and non‐associated Drp1(Red) are shown, scale bar = 1 μm. Mitochondria‐associated Drp1 puncta were analyzed by using an ImageJ plugin‐Coloc 2 and expressed as Manders’ colocalization coefficients (MCC) (J). Three different regions from each cell and > 15 cells for each experimental group were analyzed. Student's test. **P < 0.01. Data were presented as mean ± SEM of three independent experiments.
-
K, L
PINK1 regulates S616 and S637 phosphorylation of Drp1 via independent mechanisms. DRP1KO HEK293 cells cotransfected FRB‐MTS/Δ110‐PINK1‐GFP‐FKBP (PINK1WT) with either myc‐Drp1WT or myc‐Drp1S616A were treated with 250 nM rapalog (Rapalog) for 2 h to activate PINK1 kinase. Cells treated with solvent (DMSO) were included as a control. Cell lysates were immunoblotting with antibodies against either phospho (Ser616)‐Drp1 (pS616), phospho‐(Ser637)‐Drp1 (pS637), Drp1, and GFP (to detect PINK1‐FKBP) (K). β‐actin was detected as a loading control. Quantitation of pS637/Drp1 in various conditions was shown (L). One‐way ANOVA followed with Tukey's test. ***P < 0.001, ns: no significance. Data were presented as mean ± SEM of three independent experiments.

