-
A, B
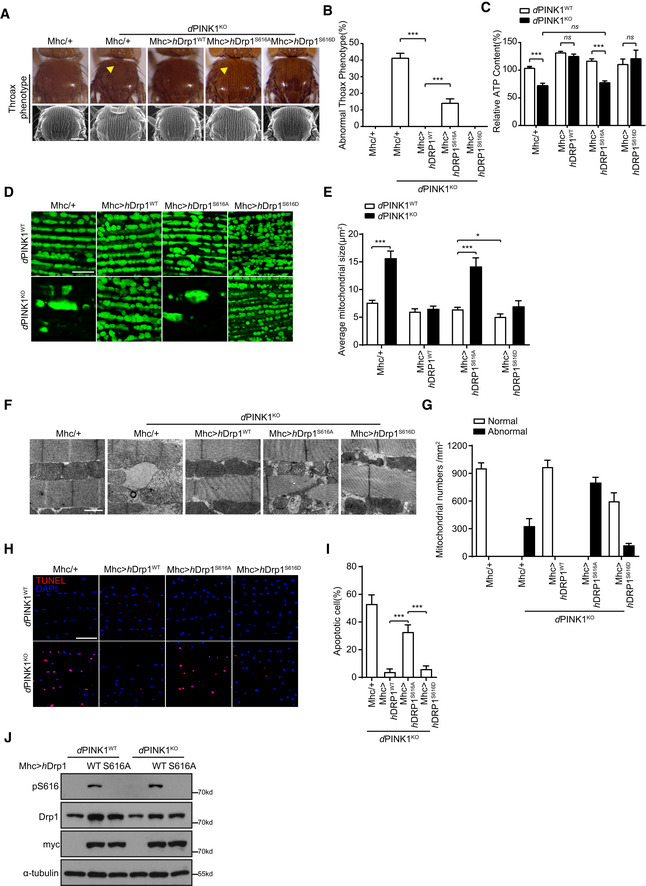
Drp1WT and Drp1S616D, but not Drp1S616A, rescue PINK1‐null induced crushed thorax in Drosophila. Representative thorax images of PINK1WT and PINK1 deficiency (PINK1KO) Drosophila expressing either mhc‐gal4 (Mhc/+), mhc‐gal4‐driven human Drp1wt (Mhc>hDrp1WT), or mhc‐gal4‐driven human Drp1S616A (Mhc>hDrp1S616A) or mhc‐gal4‐driven human Drp1S616D (Mhc>hDrp1S616D) are shown. Images were taken either under light microscopy (A, upper panels, yellow arrowhead indicates the collapsed thorax) or SEM (B, lower panels). Quantitation of crushed thorax is shown (B). > 200 flies for each experiment are analyzed. Scale bar = 200 μm. One‐way ANOVA followed with Tukey's test. ***P < 0.001. Data were presented as mean ± SEM of three independent experiments. For each condition, > 200 flies were quantified.
-
C
Drp1WT and Drp1S616D, but not Drp1S616A, restore abnormal ATP production in PINK1‐null flies. ATP production was measured using muscle lysates generated from PINK1WT flies expressing mhc‐gal4 (Mhc/+) (as a control) and PINK1KO flies expressing either mhc‐gal4 (Mhc/+), mhc‐gal4‐driven human Drp1wt (Mhc>hDrp1wt), or mhc‐gal4‐driven human Drp1S616A (Mhc>hDrp1S616A) or mhc‐gal4‐driven human Drp1S616D (Mhc>hDrp1S616D). One‐way ANOVA followed with Tukey's test. ***P < 0.001, ns: no significance. Data were presented as mean ± SEM of three independent experiments.
-
D–G
Drp1WT and Drp1S616D, but not Drp1S616A, rescue mitochondrial structures in PINK1KO flies. Representative images of mito‐GFP (green) labeled mitochondria (D) and TEM analysis (F) of IFMs from PINK1WT flies expressing mhc‐gal4 (Mhc/+) (as a control) and PINK1KO flies expressing either mhc‐gal4 (Mhc/+), Mhc‐gal4‐driven human Drp1wt (Mhc>hDrp1wt) or Mhc‐gal4‐driven human Drp1S616A (Mhc>hDrp1S616A) or mhc‐gal4‐driven human Drp1S616D (Mhc>hDrp1S616D) are shown. Scale bar = 10 μm (D) and 1 μm (F). Average mitochondrial size was quantified, and > 3 flies/group and 3–6 pictures of different microscopic fields from each fly were analyzed per repeat. One‐way ANOVA followed with Tukey's test. *P < 0.05, ***P < 0.001. Data were presented as mean ± SEM of three independent experiments (E). Normal and abnormal mitochondrial number per mm2 were quantified. > 3 flies/group and 3–6 pictures of different microscopic fields from each fly were analyzed per repeat. Bars represent the mean ± SEM of three independent experiments (G).
-
H, I
Drp1WT and Drp1S616D, but not Drp1S616A, suppress cell death in PINK1KO flies. Representative TUNEL staining (Red) images of IFM sections from PINK1WT and PINK1KO flies expressing either Mhc‐gal4 (Mhc/+), Mhc‐gal4‐driven human Drp1wt (Mhc>hDrp1WT), or Mhc‐gal4‐driven human Drp1S616A (Mhc>hDrp1S616A) or mhc‐gal4‐driven human Drp1S616D (Mhc>hDrp1S616D) are shown. Nuclei were counter‐stained with DAPI (blue), scale bar = 10 μm. Apoptotic cells (%) in different genotype flies were quantified (I). > 5 flies/group and 3–6 pictures of different microscopic fields from each fly were analyzed per repeat. One‐way ANOVA followed with Tukey's test. ***P < 0.001. Data were presented as mean ± SEM of three independent experiments.
-
J
Expression and phosphorylation of hDrp1 in Drosophila. Fly muscle lysates generated from PINK1WT or PINK1KO flies expressing mhc‐gal4‐driven hDrp1WT (WT) and hDrp1S616A (S616A) were immunoblotted with antibodies against either phospho(Ser616)‐Drp1(pS616) (to detect phosphorylated hDrp1S616), Drp1 (to detect both endogenous and exogenous Drp1), and myc‐tag (to detect exogenous Drp1). α‐tubulin was detected as a loading control. Flies expressing mhc‐gal4 (−) were included as an expression control.

