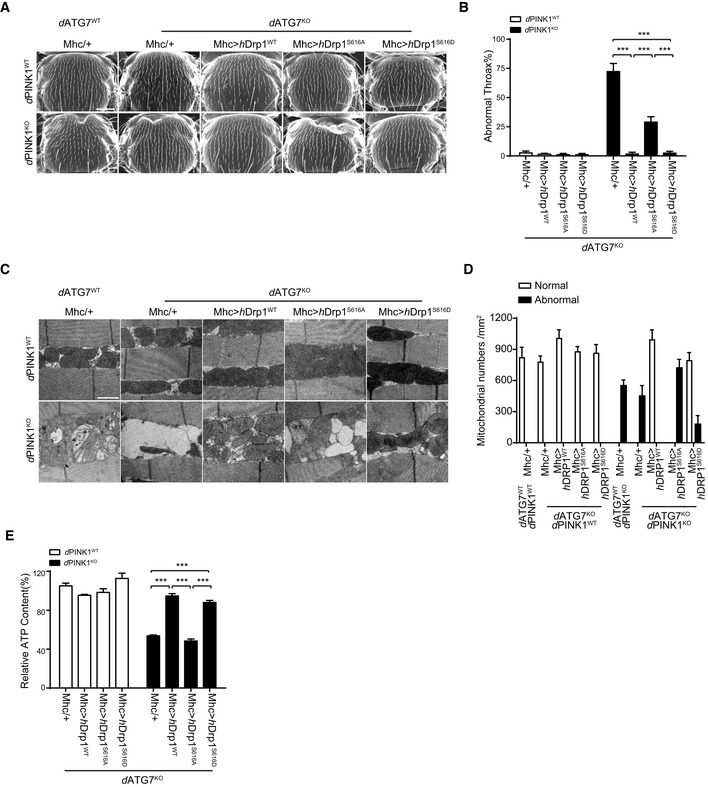
Figure 6. Drp1 rescues PINK1KO induced crushed thorax and mitochondrial abnormality in dATG7‐deficient Drosophila .

-
A, BDrp1 rescues PINK1KO induced collapsed thorax phenotype in dATG7‐deficient Drosophila. Representative SEM images of thorax from PINK1WT, (upper panels) and PINK1KO (lower panels) flies combined with dATP7 deficiency (dATG7KO) or their controls (dATG7WT), followed by expressing either mhc‐gal4 (Mhc/+) alone, or Mhc‐gal4‐driven expression of human Drp1 (Mhc>hDrp1WT), mhc‐gal4‐driven expression of human Drp1S616A (Mhc>hDrp1S616A), or mhc‐gal4‐driven expression of human Drp1S616D (Mhc>hDrp1S616D) are shown (A). Quantitation of crushed thorax in flies with indicated genotypes is presented (B). > 100 flies for each experiment are analyzed. Scale bar = 200 μm. One‐way ANOVA followed with Tukey's test. ***P < 0.001. Data were presented as mean ± SEM of three independent experiments.
-
C, DDrp1 rescues PINK1KO induced mitochondrial defects in dATG7KO Drosophila. Representative TEM images of indirect flight muscle from PINK1WT (upper panels) and PINK1KO (lower panels) flies combined with dATG7KO or their controls (dATG7WT), followed by expressing either mhc‐gal4 (Mhc/+) alone, or Mhc‐gal4‐driven expression of human Drp1(Mhc>hDrp1WT), mhc‐gal4‐driven expression of human Drp1S616A(Mhc>hDrp1S616A), or mhc‐gal4‐driven expression of human Drp1S616D(Mhc>hDrp1S616D) are shown (C). Scale bar = 1 μm. Normal and abnormal mitochondrial number per mm2 from each experimental group were and quantified. > 3 flies/group and 3–6 pictures of different microscopic fields from each fly were analyzed per repeat. Bars represent the mean ± SEM of three independent experiments (D).
-
EDrp1 rescues PINK1KO induced ATP reduction in Drosophila. ATP contents of thorax muscle tissues from the indicated genotypes were measured and normalized against the protein levels One‐way ANOVA followed with Tukey's test. ***P < 0.001, ns: no significance. Data were presented as mean ± SEM of three independent experiments.
