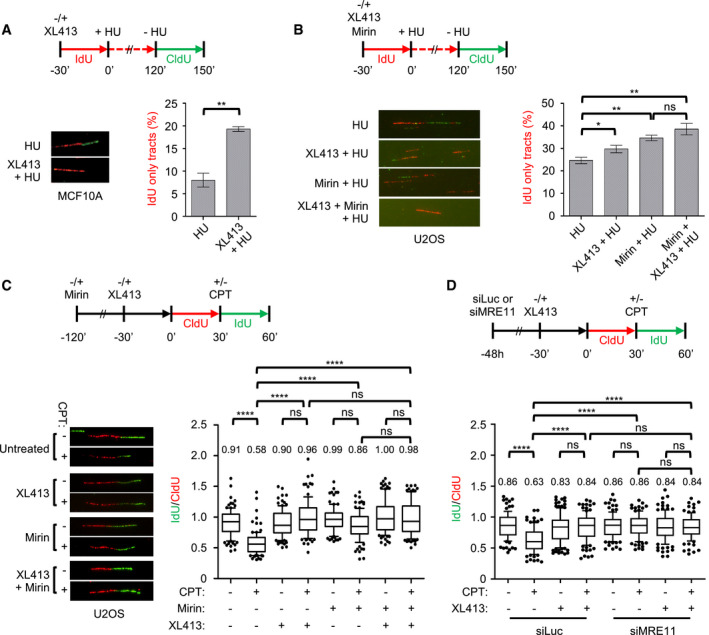
Figure 4. CDC7 is required for efficient fork restart and, together with MRE11, regulates fork speed.

- MCF10A cells were either mock‐treated or treated with 10 μM XL413 and labelled with IdU (red) for 30 min, at which point 4 mM HU was added for 2 h. HU was then washed off and cells labelled with CldU (green) in the continued presence or absence of XL413. A set of representative DNA fibres from each condition is shown, and the percentage of IdU (red)‐only tracts is plotted. At least 200 replication forks were analysed for each condition. Error bars represent SEM from three biological repeats, and statistical significance was assessed by the Student t‐test (**P ˂ 0.01).
- U2OS cells were either mock‐treated or treated with 10 μM XL413, 50 μM Mirin or both and labelled with IdU (red) for 30 min, at which point 4 mM HU was added for 2 h. HU was then washed off and cells labelled with CldU (green) in the continued presence or absence of XL413 and/or Mirin. A set of representative DNA fibres from each condition is shown, and the percentage of IdU (red)‐only tracts is plotted. At least 200 replication forks were analysed for each condition. Error bars represent SEM from four biological repeats, and statistical significance was assessed by the Student t‐test (*P < 0.05, **P ˂ 0.01).
- U2OS cells were either mock‐treated or pre‐treated for the indicated times with 10 μM XL413, 50 μM Mirin or both and labelled with CldU (red). Then, 50 nM CPT was added and cells labelled with of IdU (green) for a further 30 min. A set of representative DNA fibres from each condition is shown and the IdU/CldU tract length ratio is plotted. The box extends from the 25th to the 75th percentile with the line in the box representing the median. Whiskers indicate the 10–90 percentiles with data outside this range for individual outliers being plotted as dots. At least 100 replication forks were analysed for each condition. P‐values were calculated using one‐way ANOVA, Kruskal–Wallis test and Dunn's multiple comparison post‐test (ns, not significant; ****P < 0.0001) and are related to the experiment shown. Similar results were obtained in a second independent experiment.
- U2OS cells were transfected with control (siLuc) or MRE11‐targeting siRNA (siMRE11). After 48 h, cells were either mock‐treated or pre‐treated with 10 μM XL413 and labelled with CldU (red) for 30 min. Where indicated, 50 nM CPT was added, and then, cells were labelled with IdU (green). A set of representative DNA fibres from each condition is shown, and the IdU/CldU tract length ratio is plotted. The box extends from the 25th to the 75th percentile with the line in the box representing the median. Whiskers indicate the 10–90 percentiles with data outside this range for individual outliers being plotted as dots. At least 100 replication forks were analysed for each condition. P‐values were calculated using one‐way ANOVA, Kruskal–Wallis test and Dunn's multiple comparison post‐test (ns, not significant; ****P < 0.0001) and are related to the experiment shown. Similar results were obtained in two other independent experiments.
Source data are available online for this figure.
