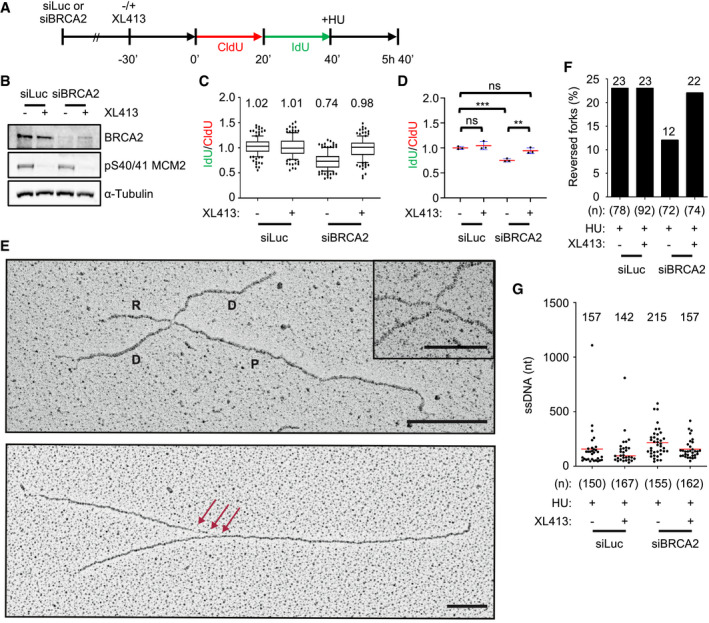
Figure 5. CDC7 promotes the nucleolytic degradation of reversed forks in BRCA2‐deficient cells.

- U2OS cells were transfected with control (siLuc) or BRCA2‐targeting siRNA (siBRCA2). After 48 h, cells were either mock‐treated or treated with 10 μM XL413 for 30 min and labelled consecutively with CldU (red) and IdU (green), followed by treatment with 4 mM HU for a further 5 h.
- Representative Western blot of indicated proteins obtained from whole‐cell extracts. pS40/41 on MCM2 indicates effective CDC7 inhibition by XL413.
- The ratios of IdU/CldU tract length are plotted. The box extends from the 25th to the 75th percentile with the line in the box representing the median. Whiskers indicate the 10–90 percentiles with data outside this range for individual outliers being plotted as dots. Mean values of IdU/CldU ratios are indicated above the plot. At least 100 replication forks were analysed for each condition.
- The mean values of IdU/CldU tract length ratios from three independent experiments are plotted, with the standard deviation (blue lines) and mean (red line). Statistical analysis: Student's t‐test; ns, not significant; **P < 0.01; ***P < 0.001
- Electron micrographs of representative replication forks from U2OS cells: A reversed fork is labelled: P = parental strand; D = daughter strand; and R = regressed arm; the four‐way junction at the reversed fork is magnified in the inset. The red arrows indicate single‐stranded DNA at the fork. Scale bar is 200 nm (= 460 bp) and 100 nm (= 230 bp) in the inset.
- Frequency of reversed replication forks isolated from mock‐depleted (siLuc) and BRCA2‐depleted (siBRCA2) U2OS cells upon 5‐h treatment with 4 mM HU in the presence or absence of 10 μM XL413. The number of replication intermediates analysed is indicated in parentheses. Similar results were obtained in two independent experiments (Appendix Table S1).
- Amount of ssDNA length at the junction (red arrows in Fig 4D) in siLuc and siBRCA2 U2OS cells treated with 4 mM of HU for 5 h in the presence or absence of XL413. N indicates the number of forks observed, and only molecules with detectable ssDNA stretches are included in the analysis. The lines show the mean length of ssDNA regions at the fork, and the value is displayed above the plot.
Source data are available online for this figure.
