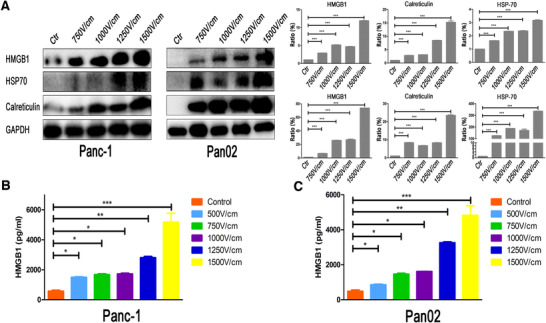
FIGURE 8.

IRE induces ICD of tumor cells. A, The expression and the quantification of integrated optical density of the protein bands of intracellular DAMPs of Panc‐1 and Pan02 treated by electric fields with different field strengths. The expression of HMGB1, HSP70, and calreticulin increased significantly along with the increasing strength of electroporation. B, The analysis of released HMGB1 in TSN of Panc‐1 treated with electric fields with different field strengths by enzyme‐linked immunosorbent assay (ELISA). C, The analysis of released HMGB1 in TSN of Pan02 treated with electric fields with different field strengths by ELISA. The levels of secreted HMGB1 in TSN of Panc‐1 and Pcan02 increased significantly along with the increasing strength of electroporation. One‐way analysis of variance (ANOVA) with Bonferroni comparison test was performed. *P < .05, **P <.01, ***P < .001
