-
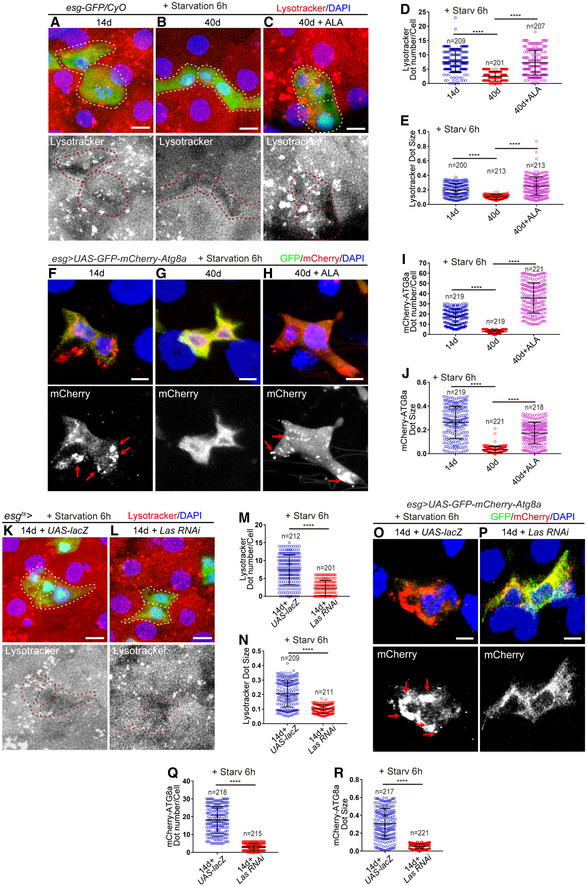
A–C
Immunofluorescence images of esg‐GFP and Lysotracker staining with the midgut section from the R4 region in 14‐day WT flies (A), 40‐day WT flies (B), 40‐day WT flies with ALA administration (C). esg‐GFP (green; outlined by dotted lines), lysotracker (red). esg‐GFP+ cells are outlined by red dotted lines in the images of lysotracker staining channel.
-
D
Quantification of the dot number of Lysotracker in esg‐positive cells from experiments (A‐C). n is indicated. The numbers of quantified guts from left to right are 9, 11, and 8.
-
E
Quantification of the dot size of Lysotracker in esg‐positive cells from experiments (A–C). n is as indicated.
-
F–H
Expression of esg‐GAL4‐driven UAS‐GFP‐mCherry‐Atg8a in 14‐day Drosophila (F), 40‐day Drosophila (G), 40‐day Drosophila with ALA administration started at the middle age (26 days) (H). GFP (green) and mCherry (red). The red arrows indicate the autophagosomes.
-
I
Quantification of the dot number of mCherry in esg‐positive cells from experiments (F–H). n is indicated. The numbers of quantified guts from left to right are 11, 10, and 12.
-
J
Quantification of the dot size of mCherry in esg‐positive cells from experiments (F–H). n is as indicated.
-
K, L
Immunofluorescence images of esg‐GFP and Lysotracker staining with the midgut section from the R4 region in 14‐day flies carrying esg
ts‐GAL4‐driven UAS‐lacZ (K), and 14‐day flies carrying esg
ts‐GAL4‐driven Las RNAi (L). esg‐GFP (green; outlined by dotted lines), lysotracker (red). esg‐GFP+ cells are outlined by dotted lines.
-
M
Quantification of the dot number of Lysotracker in esg‐positive cells from experiments (K, L). n is indicated. The numbers of quantified guts from left to right are 10, and 9.
-
N
Quantification of the dot size of Lysotracker in esg‐positive cells from experiments (K, L). n is as indicated.
-
O, P
Expression of esg‐GAL4‐driven UAS‐GFP‐mCherry‐Atg8a in 14‐day Drosophila carrying esg
ts‐GAL4‐driven UAS‐lacZ (flies were cultured at 18°C and transferred to 29°C after flies eclosion) (O), and 14‐day Drosophila with Las depleted in ISCs and EBs (flies were cultured at 18°C and transferred to 29°C after flies eclosion) (P). GFP (green) and mCherry (red). The red arrows indicate the autophagosomes.
-
Q
Quantification of the dot number of mCherry in esg‐positive cells from experiments (O, P). n is indicated. The numbers of quantified guts from left to right are 11, and 10.
-
R
Quantification of the dot size of mCherry in esg‐positive cells from experiments (O, P). n is as indicated.
Data information: DAPI‐stained nuclei are shown in blue. Scale bars represent 5 μm (A–C and K–L) and 2 μm (F–H and O, P). Error bars represent SDs. Student's
> 0.05. See also Fig
.