-
A–E
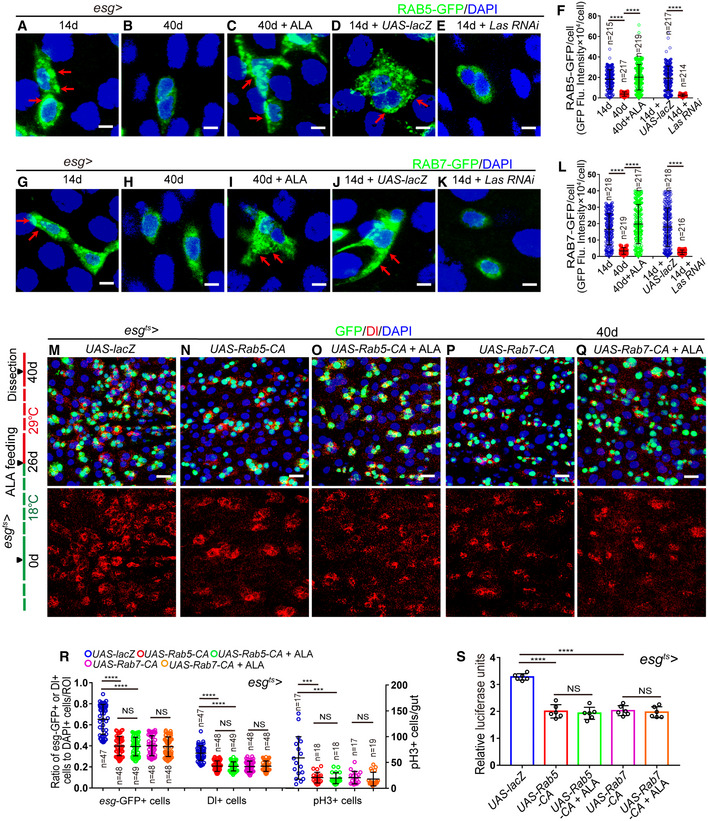
Expressions of Rab5‐GFP reporter in ISCs of 14‐day WT Drosophila (A), 40‐day WT Drosophila (B), 40‐day Drosophila with ALA administration (C), 14‐day Drosophila carrying esg
ts
‐GAL4>UAS‐lacZ (D), and 14‐day Drosophila carrying esg
ts
‐GAL4>Las RNAi (E). GFP (green).
-
F
Quantification of fluorescence intensity of RAB5‐GFP in experiments (A–E). Each dot corresponds to one cell. n is indicated. The numbers of quantified guts from left to right are 13, 11, 12, 10 and 13.
-
G–K
Expressions of Rab7‐GFP reporter in ISCs of 14‐day WT Drosophila (G), 40‐day WT Drosophila (H), 40‐day Drosophila with ALA administration (I), 14‐day Drosophila carrying esg
ts
‐GAL4>UAS‐lacZ (J), and 14‐day Drosophila carrying esg
ts
‐GAL4>Las RNAi (K). GFP (green).
-
L
Quantification of fluorescence intensity of RAB7‐GFP in experiments (G–K). Each dot corresponds to one cell. n is indicated. The numbers of quantified guts from left to right are 11, 10, 11, 13, and 12.
-
M–Q
Immunofluorescence images of midgut section from the R4 region of Drosophila carrying esg
ts
‐GAL4‐driven expression of lacZ cDNA (M, control), constitutively active form of RAB5 (N), constitutively active form of RAB5 with ALA administration (O), constitutively active form of RAB7 (P), or constitutively active form of RAB7 with ALA administration (Q). GFP (green) and Dl staining (red) was used to visualize ISCs.
-
R
Quantification of the number of esg‐GFP+ cells, Dl+ cells, and pH3+ cells in experiments (M–Q). n is indicated. The numbers of quantified guts from left to right are 17, 18, 18, 17, 19, 17, 18, 18, 17, 19, 17, 18, 18, 17, and 19.
-
S
Quantification of luciferase activity in Drosophila with indicated genotypes and applied manipulations. Error bars show the SD of six independent experiments.
Data information: DAPI‐stained nuclei are shown in blue. Scale bars represent 2 μm (A–E, G–K), and 10 μm (M–Q). Error bars represent SDs. Student's
> 0.05. See also Fig
.