-
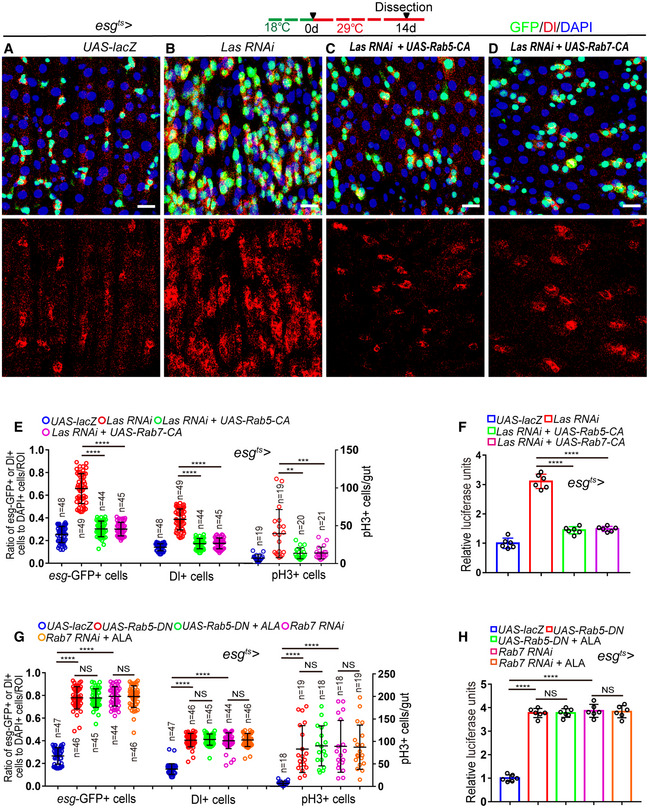
A–D
Representative images of midgut sections from the R4 region of Drosophila carrying esg
ts‐GAL4‐driven expression of lacZ cDNA (A, control), Las RNAi (B), Las RNAi and RAB5‐CA (C), or Las RNAi and RAB7‐CA (D). GFP (green), Dl staining (red) was used to visualize ISCs.
-
E
Quantification of the number of esg‐GFP+ cells, Dl+ cells, and pH3+ cells in experiments (A–D). n is indicated. The numbers of quantified guts from left to right are 19, 19, 20, 21, 19, 19, 20, 21, 19, 19, 20, and 21.
-
F
Quantification of the luciferase activity of midguts of Drosophila with indicated genotypes and manipulations. Error bars show the SD of six independent experiments.
-
G
Quantification of esg‐GFP+ cells, Dl+ cells, and pH3+ cells in midguts of Drosophila with indicated genotypes and manipulations. n is indicated. The numbers of quantified guts from left to right are 18, 19, 18, 18, 19, 18, 19, 18, 18, 19, 18, 19, 18, 18, and 19.
-
H
Quantification of luciferase activity of midguts of Drosophila with indicated genotypes and manipulations. Error bars show the SD of six independent experiments.
Data information: DAPI‐stained nuclei are shown in blue. Scale bars represent 10 μm (A–D). Error bars represent SDs. Student's
> 0.05. See also Fig
.