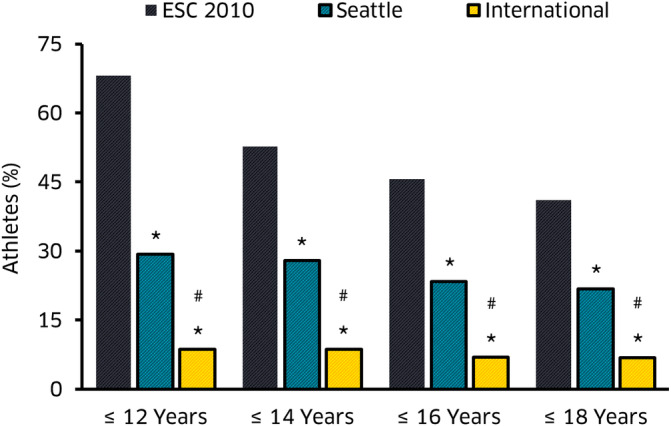
FIGURE 1.

Bar chart shows the percentage of false‐positive ECG findings according to the 3 ECG interpretation criteria by chronological age. *P < .05, significantly reduced prevalence to ESC 2010 recommendations. #P < .05, significantly reduced prevalence to Seattle Criteria, reproduced with permission from Reference 61
