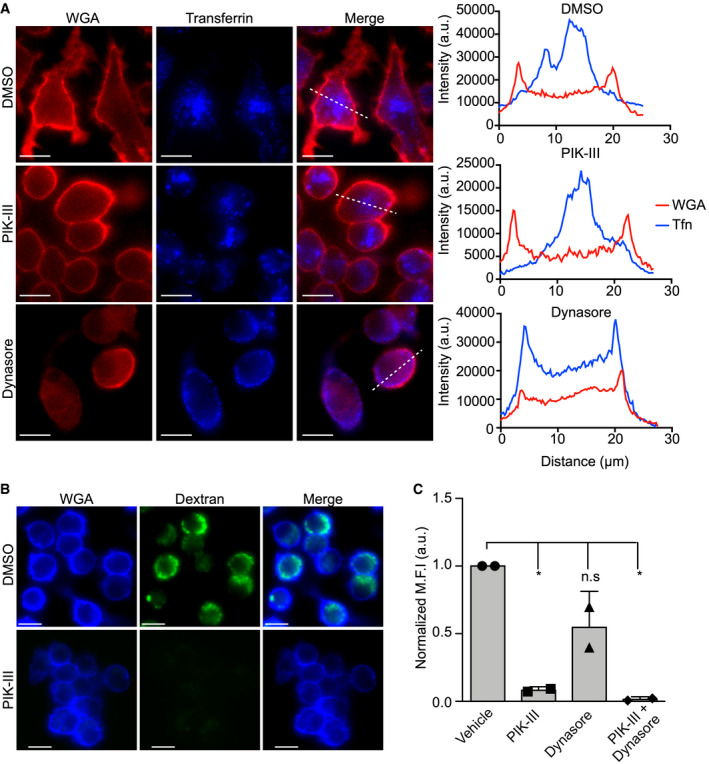
Figure 3. The uptake of macromolecules from the extracellular environment can be inhibited pharmacologically.

- Uptake of Alexa® Fluor 647‐conjugated transferrin by RAW 264.7 macrophages in the presence and absence of PIK‐III and Dynasore. The fluorescence micrographs show transferrin (in blue) and the macrophage plasmalemma demarcated by TMR‐conjugated wheat germ agglutinin (in red). The dashed line indicates the region of the cell for which the line scan analysis, shown graphically on the right, was done. These micrographs are representative images obtained from three independent experiments. Line scan analysis was performed to indicate the distribution of fluorescent transferrin (blue line) relative to the plasmalemma (red line) for the DMSO‐, PIK‐III and Dynasore‐treated cells presented in the fluorescence micrographs. Scale bars equal 10 μm.
- RAW macrophages were pre‐treated with vehicle (DMSO) or the vps34 inhibitor PIK‐III prior to the addition of 10 kDa FITC–dextran (100 μg/ml) for 2 h. Prior to imaging live, macrophages were also stained with Cy5‐conjugated WGA. The representative micrographs depict inhibited dextran uptake indicating PIK‐III treatment can perturb fluid‐phase uptake. Scale bars equal 10 μm.
- The intensity of dextran fluorescence was quantified for RAW cells pre‐treated with vehicle, PIK‐III (10 μM), Dynasore (100 μM), or PIK‐III and Dynasore (10 and 100 μM), respectively. The data shown are the mean fluorescence intensity ± standard deviation for each experiment calculated from at least 30 cells from two independent experiments. * indicates P < 0.05, as determined by an ordinary one‐way ANOVA with a Bonferroni multiple comparisons test.
