-
A, C
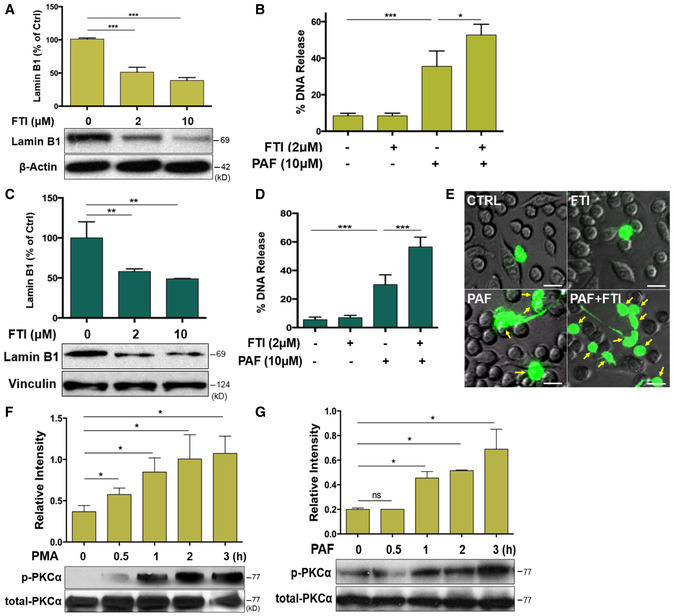
Summary and representative immunoblot analysis for the mature lamin B expression in HL‐60 dPMNs (A) or RAW264.7 cells (C) that were treated without (0) or with 2 or 10 μM farnesyltransferase inhibitor (FTI) L‐744,832 for 48 h.
-
B, D, E
Summary analysis (B, D) and representative images (E) of extracellular trap release in HL‐60 dPMNs (B) RAW264.7 cells (E) that were pretreated without or with 2 μM for 48 h, followed by treatment or not with 10 μM PAF for 3 h and then stained with cell‐impermeable SYTOX Green, without fixation. Fluorescent and phase‐contrast images were taken by Olympus confocal microscopy. The yellow arrows indicate neutrophils with NET formation. Scale bars, 20 μm (E).
-
F, G
Representative immunoblots and the summary analyses of total and phosphorylated PKCα (p‐PKCα), in human dPMNs that were treated either by PMA (F) or PAF (G) for 0, 0.5, 1, 2, 3 h.
Data information: The summary analyses were calculated based on the arbitrary density of immunoblot images (A, C, F, G), or % DNA release index was analyzed by comparison of the fluorescent intensity of the indicated conditions to an assigned value of 100% for the total DNA released by neutrophils lysed by 0.5% (
v/
v) Triton X‐100 (B, D) as compared to their untreated controls. Data are given as mean ± SD from at least three independent biological replicates. *
P < 0.05, **
P < 0.01, ***
P < 0.01 between different groups as indicated. Comparisons among three or more groups were performed using ANOVA, followed by Student–Newman–Keuls test.
Source data are available online for this figure.

