. 2020 Jun 15;21(8):e48779. doi: 10.15252/embr.201948779

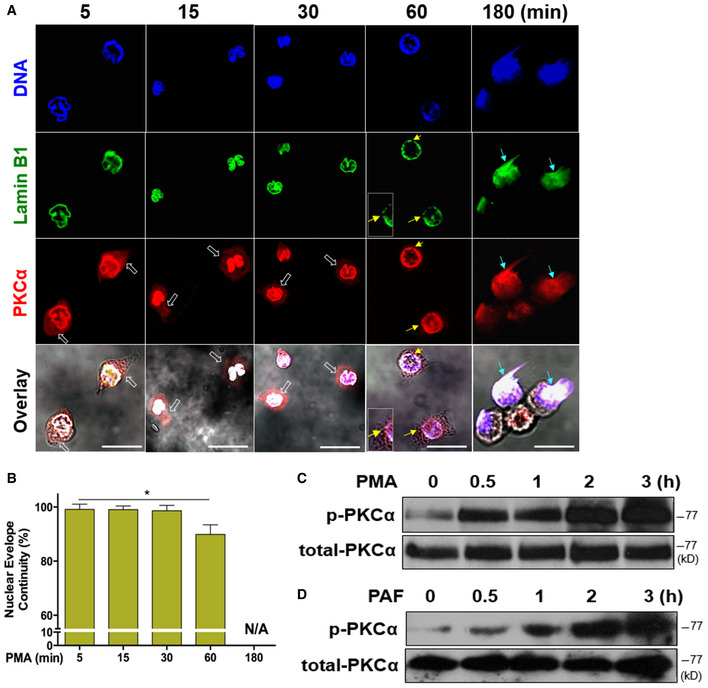
Figure 3. Nuclear translocation and phosphorylation of PKCα is accompanied by nuclear envelope rupture during NET formation.

Figure 3

  • A
    Representative images for the time course of PKCα nuclear translocation, subsequent nuclear envelope rupture, and DNA release in human dPMNs exposed to 50 nM PMA for 5, 15, 30, 60, and 180 min and then stained concomitantly for DNA (DAPI), nuclear lamin B (primary anti‐lamin B, and FITC‐labeled secondary antibody), and PKCα (primary anti‐human PKCα, and PE‐labeled secondary antibody), followed by confocal fluorescent microscopy analysis. White empty arrows indicate cytoplasmic distribution of PKCα at 5, 15, and 30 min, yellow arrows indicate site of discontinuity/rupture of nuclear envelope at 60 min, light blue arrows display the sites of nuclear envelope rupture and chromatin release at 180 min (A). Scale bars, 20 μm. The time course started 5 min after PMA stimulation in order to allow the adherence of neutrophils on the bottom of dish for immunocytostaining.
  • B
    Summary analysis of the nuclear envelope continuity was analyzed based on staining of the nuclear envelope with primary anti‐lamin B, and FITC‐labeled secondary antibody.
  • C, D
    Representative immunoblots of total PKCα and p‐PKCα in primary human pPMNs that were treated by PMA (C) or PAF (D) for 0, 0.5, 1, 2, 3 h.
Data information: The summary analyses of panel (B) were calculated based on the circumferences/perimeters of the cell nuclei of 7–10 cells from different time points from 3 to 6 independent experiments. Data in (B) represent mean ± SD (n = 3–6 biological replicates). *P < 0.05 between groups as indicated. Comparisons among three or more groups were performed using ANOVA, followed by Student–Newman–Keuls test.Source data are available online for this figure.