-
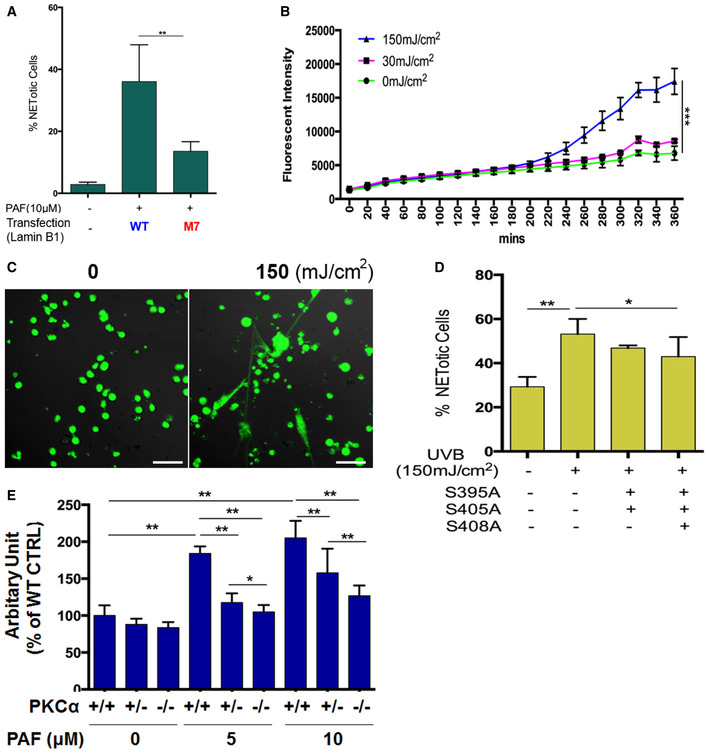
A
Summary analysis of extracellular trap formation in the RAW264.7 cells that were transfected with plasmids of either wild‐type lamin B (WT control), or the M7 mutant of PKCα‐consensus phosphorylation sites (S395A/S405A/S408A) of lamin B, and treated by 10 μM PAF for 3 h. The cells were stained by cell‐impermeable dye SYTOX Green (500 nM), and the total cells were detected by staining with cell‐permeable dye SYTO Red (500 nM). Images were taken by Olympus confocal microscopy, followed by automated quantification of NETs using ImageJ for quantification of % cells with extracellular trap release. RAW264.7 cells without transfection and without PAF treatment were served as basal control.
-
B, C
Summary (B) and representative (C) analysis of NET formation in dPMNs that were irradiated without or with UVB at 30 or 150 mJ/cm2, in medium containing 1 μM SYTOX Green dye for 6 h with recording every 20 min by a microplate reader for up to 6 h. Then, the plates were analyzed with microplate reader for fluorometric NET quantification. Scale bar, 50 μm.
-
D
Summary analyses of NET formation in the dPMNs that were transfected with plasmids of either wild‐type lamin B (WT control for the left two columns), or the M4 or M7 mutants and then were irradiated without or with UVB at 150 mJ/cm2. Then, the staining and quantification of % NETotic cells were conducted as described in panel (A).
-
E
Summary analyses of NET formation in mouse bone marrow mPMNs, from WT, heterozygous, or homozygous PKCα‐deficient mice, which were treated without or with either 5 or 10 μM of PAF for 3 h, following by fluorometric NET quantification analysis. Data information: The panels (A, B, D) were calculated based on at least 3 independent biological replicates. Panel (E) is a summary analysis that was calculated based on the arbitrary fluorescent unit from 3 independent biological replicates. Data are given as mean ± SD. *P < 0.05, **P < 0.01, ***P < 0.001 between groups as indicated. Comparisons among three or more groups were analyzed using ANOVA, followed by Student–Newman–Keuls test.

