-
A
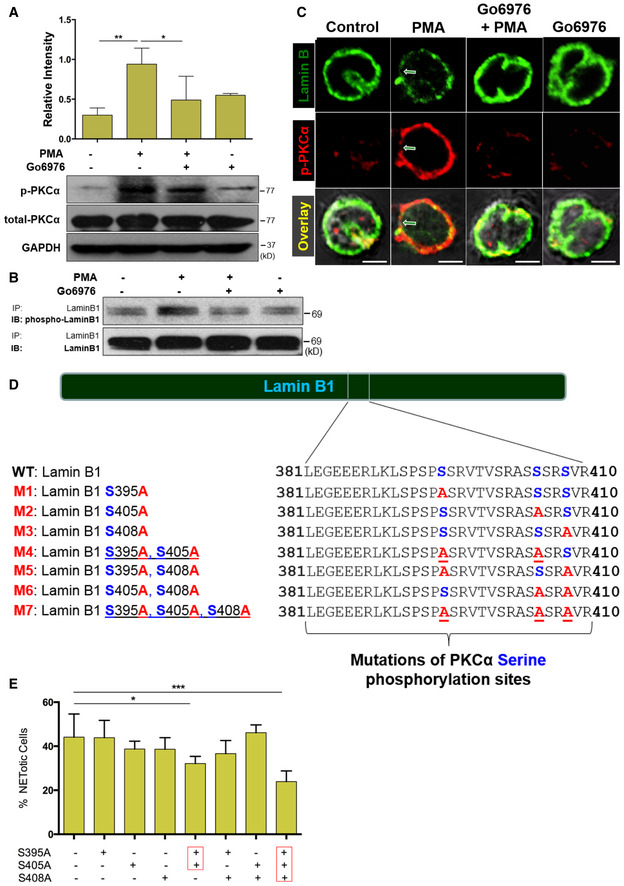
Summary and representative immunoblots of total PKCα and p‐PKCα in dPMNs that were pretreated without or with PKC inhibitor Go6976 for 1 h and then treated without or with PMA (A) for 3 h.
-
B
Immunoblot (IB) detection of the phospho‐lamin B and total lamin B with lamin B protein purified by immunoprecipitation (IP) with anti‐lamin B from human dPMNs that were pretreated without or with PKC inhibitor Go6976 for 1 h and then treated by PMA (B) for 3 h.
-
C
Confocal microscopy images of human dPMNs that were pretreated without or with PKCα Go6976 for 1 h and then treated without or with PMA for 3 h, followed by staining of lamin B (primary anti‐lamin B, and FITC‐labeled secondary antibody), and phosphorylated PKCα (primary anti‐human p‐PKCαS657, and PE‐labeled secondary antibody). The green/white arrows indicate the site of nuclear envelope rupture. Scale bars, 10 μm.
-
D
Schematic representation of lamin B domain structure and several mitotic serine phosphorylation sites (indicated by blue font) that exhibit PKC consensus motifs (Mall
et al,
2012) and overview of lamin B reporters containing serine (S) to alanine (A) mutations at PKC consensus phosphorylation sites.
-
E
The endpoint analysis of % cells with NET formation was detected with dPMNs that were transfected with plasmids of either wild‐type lamin B (WT control) or mutants with single or multiple defined point mutations at PKCα‐consensus phosphorylation sites (S395A, S405A, S408A) of lamin B, and treated for 3 h by 10 μM PAF in medium containing cell‐permeable dye SYTO Red (500 nM) for the total cell count, while the cells with NET formation were stained by cell‐impermeable dye SYTOX Blue (5 μM). Then, the images were taken with Olympus confocal microscopy, followed by automated quantification of NETs using ImageJ for quantification of % cells with NET formation.
Data information: Panels (A) is summary analyses of immunoblots that were calculated based on the arbitrary unit (A), or percentage of cells with NET formation by immunofluorescent imaging quantification using ImageJ (E), from 3 to 5 independent experiments. Data represent mean ± SD (
n = 3–5 biological replicates). *
P < 0.05, **
P < 0.01, ***
P < 0.001, between groups as indicated. Comparisons among three or more groups were performed using ANOVA, followed by Student–Newman–Keuls test.
Source data are available online for this figure.

