-
A
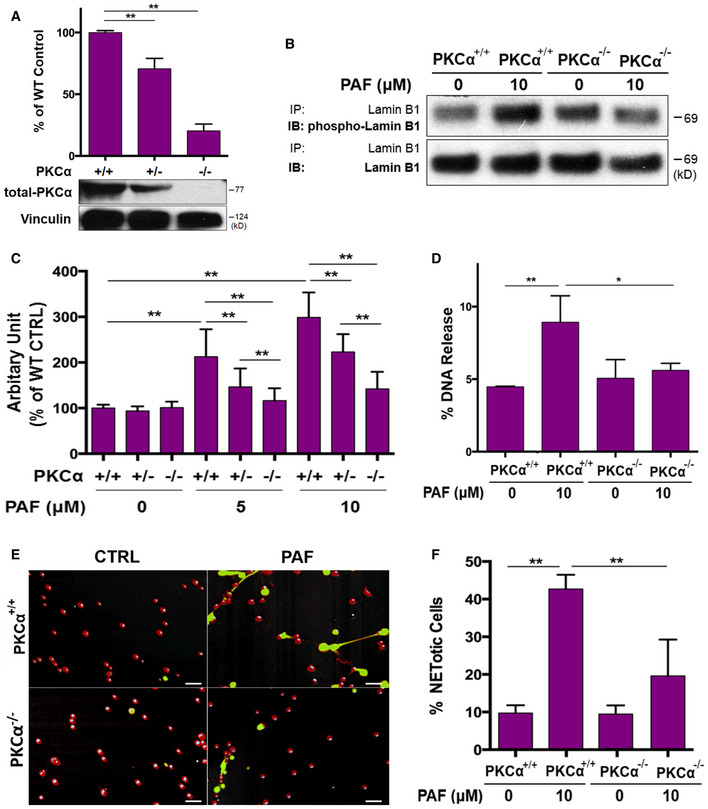
Summary and representative immunoblots of PKCα expressions in mouse bone marrow neutrophils from PKCα−/−, PKCα+/−, and their littermate WT (PKCα+/+) mice. Vinculin served as loading control.
-
B
Representative immunoblot (IB) detection of the phospho‐lamin B (Ser) and total lamin B with lamin B protein purified by immunoprecipitation (IP) with anti‐lamin B from mouse peritoneal mPMNs from WT vs. PKCα−/− mice, stimulated without or with PAF for 3 h.
-
C
Summary analyses of NET formation in peritoneal mPMNs, from WT, PKCα+/−, or PKCα−/− mice, which were treated without or with either 5 μM or 10 μM PAF for 3 h following by 2% PFA fixation and fluorometric microplate analysis.
-
D
The endpoint analysis of NET‐DNA release index was detected by coincubation of primary mouse peritoneal mPMNs from WT and PKCα−/− mice without (control) or with 10 μM PAF in medium containing 1 μM SYTOX Green dye with recording by a microplate reader at the end of the 3 h time point. The NET‐DNA release index was reported in comparison with an assigned value of 100% for the total DNA released by neutrophils lysed by 0.5% (v/v) Triton X‐100.
-
E, F
(E) Representative and (F) summary analysis of NET formation of mouse peritoneal mPMNs from WT vs. PKCα−/− mice stimulated without or with 10 μM PAF for 3 h and stained with both cell‐permeable SYTO Red dye and cell‐impermeable SYTOX Green dye, without fixation. Images were taken by Olympus confocal microscopy, followed by automated quantification of NETs on 5–6 non‐overlapping area per well using ImageJ for calculation of % cells with NET formation. (E) Scale bars, 50 μm.
Data information: Panels (A, C, D, F) were summary analyses that were calculated based on the arbitrary unit (A) or arbitrary fluorescent readout (C), endpoint analysis of NET‐DNA release index (D), or % cells with NET formation by image analysis using ImageJ (F) from 3 to 6 independent experiments as compared to their WT or untreated controls. Data represent mean ± SD (
n = 3–6 biological replicates), *
P < 0.05, **
P < 0.01 between groups as indicated. Comparisons among three or more groups were performed using ANOVA, followed by Student–Newman–Keuls test.
Source data are available online for this figure.

