-
A–C
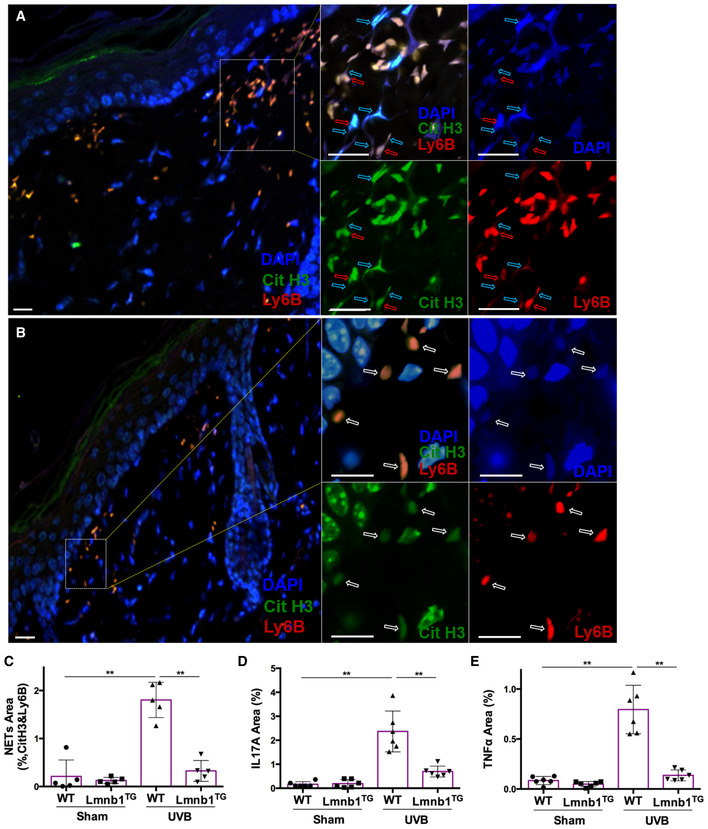
(A, B) representative (C) summary analysis of confocal fluorescent microscopy images of neutrophils with NET formation in the skin tissue of WT (A) vs. Lmnb1TG (B) mice with UVB exposure, in which DNA was stained by DAPI, citrullinated histone H3 was probed by rabbit anti‐mouse citrullinated histone H3, following stained by Alexa Fluor‐488‐labeled donkey anti‐rabbit secondary antibody, while neutrophil surface marker Ly6B was probed by rat anti‐mouse Ly6B Ab following stained by Alexa Fluor‐647‐conjugated goat anti‐rat secondary antibody. The images of different staining and their overlays are shown (A, B). The parental neutrophils (stained by neutrophil membrane surface marker Ly6B) and their released extracellular NET structures (co‐stained by anti‐cit H3 and DAPI) are indicated by red arrows and light blue arrows, respectively. The white arrows indicated neutrophils without NET release. Scale bar, 50 μm.
-
D, E
Summary analysis for staining area of neutrophils with NET formation and their exhibition of IL‐17A (D) or TNFα (E), in the skin tissue of WT vs. Lmnb1TG mice without (sham) or with UVB exposure, by co‐staining of Ly6B (stained as described in panels A–C) with IL‐17A (D) or TNFα (E) using FITC‐conjugated rat anti‐mouse IL‐17A, or FITC‐conjugated rat anti‐mouse TNFα Abs.
Data information: DNA was stained by DAPI. Panels (C–E) are summary analyses that were calculated based on the arbitrary fluorescent unit (C–E) from 5 to 6 independent experiments of different groups as indicated. Data represent mean ± SD (
n = 5–6 biological replicates). **
P < 0.01 between groups are indicated. Comparisons among three or more groups were performed using ANOVA, followed by Student–Newman–Keuls test.

