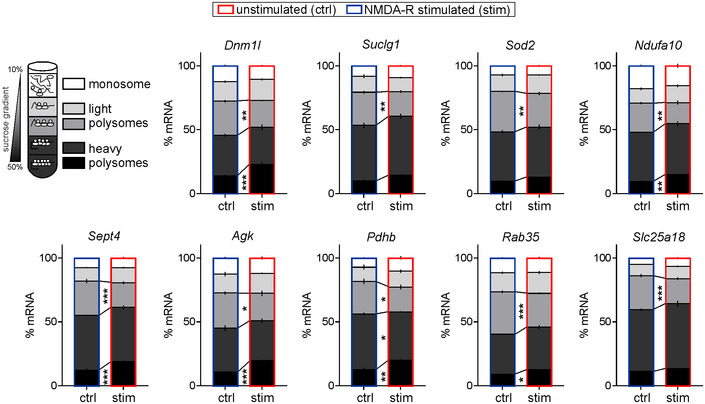
Figure EV2. Related to Fig 2. Validation of RNA‐seq data using qRT–PCR on polysomal fractions.

Graphs show percentage of mRNAs in different fractions from unstimulated and NMDA‐R‐stimulated synaptoneurosomes (20 min stimulation). Fractions as in Fig 2: fraction I—monosome, fractions II‐III—light polyribosomes, and fractions IV‐V—heavy polyribosomes. Selected transcripts encoding for mitochondrial proteins shift toward the heavy polyribosomal fractions upon the NMDA‐R stimulation (n = 4 biological replicates; *P < 0.05, **P < 0.01, ***P < 0.001; one‐way ANOVA, post hoc Sidak's multiple comparisons test; error bars indicate SEM).
