
Figure 3.
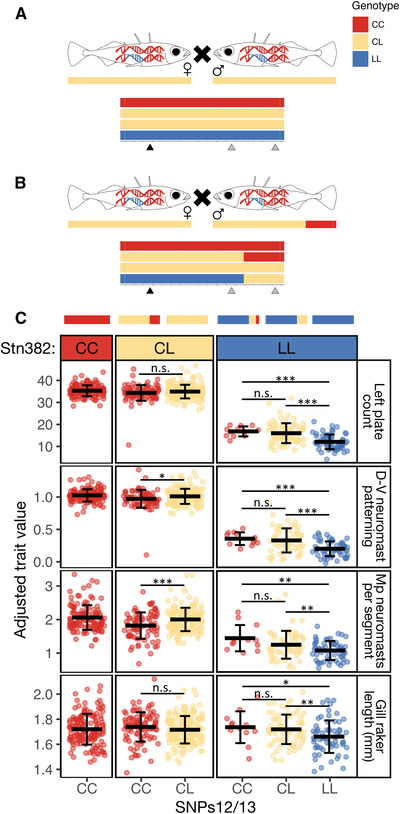
Crosses between Puget Sound fish carrying different‐sized haplotypes reveal effects of freshwater alleles on multiple phenotypes. (A) Schematic of the five crosses between heterozygous marine carriers of the full freshwater haplotype (CL genotype). (B) Schematic of the five crosses between one carrier of the full haplotype and one carrier of a short haplotype. In both (A) and (B), the possible genotypes of offspring are visualized below the parents, along with triangles marking the three markers at which offspring were genotyped—Stn382, NAKA SNP, and SNPs12/13. Not pictured is the single cross between two carriers of different short haplotypes, which produced some offspring with a tricolored haplotype, depicted in (C). (C) Trait values for four phenotypes are plotted by offspring genotypes at Stn382 and SNPs12/13. Representative haplotypes are drawn above the plots. Mean trait value ± SD are depicted by black lines and whiskers. Left plate count is strongly associated with genotype at Stn382 (LOD = 344; PVE = 93.6), and the C allele is dominant (CC and CL fish have similar trait values). However, SNPs12/13 are also associated with plate number in fish that are homozygous LL at Stn382 (fish LL at SNPs12/13 have fewer plates than fish CC and CL at SNPs12/13; t 151 = –6.54, P = 4.4 × 10⁻¹⁰). The same pattern is observed in the dorsal‐ventral (D‐V) patterning of neuromasts and the number of neuromasts per segment in the Mp line. In contrast, gill raker length is not associated with genotype at Stn382, but it is associated with genotype at SNPs12/13 (LOD = 4.6; PVE = 3.7). Adjusted trait values were calculated by adding the residual trait value for each individual to the predicted trait value when all the covariates are equal (sex, standard length, and family). Significance levels: * * * P < 0.001; * * P < 0.01; * P < 0.05; P > 0.05 (not significant).