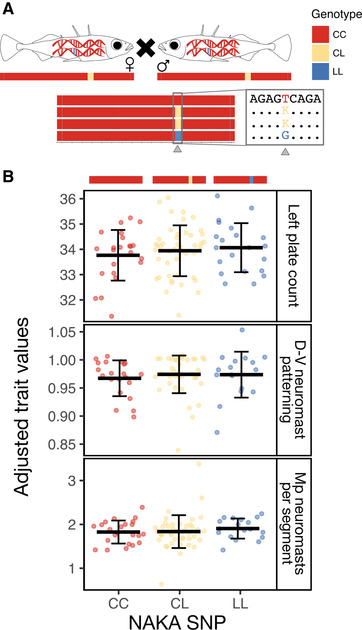
Figure 5.

The NAKA SNP is not sufficient to cause variation in traits. (A) Schematic of crosses between heterozygous marine carriers of the NAKA SNP (CL genotype). Possible offspring genotypes are visualized below the parents, along with a triangle marking the NAKA SNP. The box contains the DNA sequence immediately surrounding the NAKA SNP. (B) Trait values for three phenotypes are plotted by offspring genotypes at the NAKA SNP. Representative genotypes are drawn above the plots. Mean trait value ± SD are depicted by black lines and whiskers. There is no association between genotype at the NAKA SNP and any of the three phenotypes—left plate count, dorsal‐ventral (D‐V) patterning of neuromasts or neuromasts per body segment along the posterior main trunk line (Mp). Adjusted trait values were calculated by adding the residual trait value for each individual to the predicted trait value when all the covariates are equal (sex, standard length, and family).
