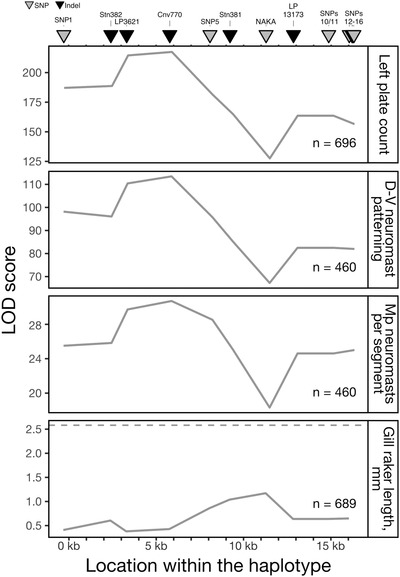
Figure 6.

Association mapping of traits in Lake Washington stickleback reveals a similar pattern of association shared by three traits. The strength of association between each marker and each phenotype was calculated as a log odds likelihood (LOD) score compared with the model of no association between marker and phenotype. These LOD curves are plotted for four traits. Left plate count, dorsal‐ventral patterned segments, and Mp neuromasts per segment have significant LOD scores (LOD thresholds range from 2.7 to 2.9) and show very similar LOD curves, suggesting these traits are controlled by the same mutation(s). The LOD curve for gill raker length is shown, because this trait significantly mapped to the 3′ region (SNPs12‐13) of the haplotype in the Puget Sound crosses. However, as shown here, this trait does not significantly map to any marker within the haplotype in the Lake Washington population (LOD threshold = 2.6, dashed line).
