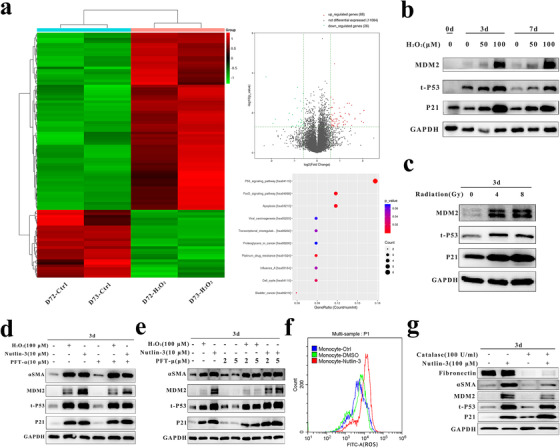
FIGURE 4.

The p53 stabilizer nutlin‐3 induced MMT through ROS generation but not through the p53 transcription/mitochondria‐dependent signaling pathway. A, RNA‐seq analysis of monocytes obtained from two healthy donors (D72 and D73), and treated or not treated with 100 µM H2O2 for 7 days. The heatmap shows hierarchical clustering of mRNA levels of genes in monocytes treated as indicated; the volcano plot shows differentially expressed genes plotted as the log2(fold change) versus the –log10(P‐value). A total of 94 differentially expressed genes between the H2O2‐treated cell group and the control cell group exceeded the established thresholds (–log10(P‐value) > 1.30 and |log2‐fold change| > .585; upregulated genes are shown in red, and downregulated genes are shown in green). KEGG pathway analysis was performed on the upregulated genes identified by RNA‐seq. B and C, Western blot analysis of the expression of p53 and the target genes p21 and MDM2 in freshly isolated monocytes (0 day), monocytes treated with 0/50/100 µM H2O2 for 3/7 days, and monocytes treated with radiation (0/4/8 Gy) for 3 days. GAPDH was used as the loading control. D and E, Western blot analysis of the expression of αSMA, p53, p21, and MDM2 in monocytes treated or not treated with nutlin‐3, H2O2, PFT‐α, or PFT‐μ. GAPDH was used as the loading control. F, Representative flow cytometric analysis of intracellular ROS levels in monocytes treated or not treated with nutin‐3 (10 µM) or the same volume of DMSO (blue, ctrl; green, DMSO; red, nutlin‐3). G, Western blot analysis of monocytes treated or not treated with 10 µM nutlin‐3 or 100U/mL catalase. GAPDH was used as the loading control. Data are representative of three experiments
Abbreviations: MMT, monocyte‐to‐myofibroblast transdifferentiation; RNA‐seq, RNA sequencing; DEGs, differentially expressed genes; KEGG, Kyoto Encyclopedia of Genes and Genomes; DMSO, dimethyl sulfoxide.
