-
A
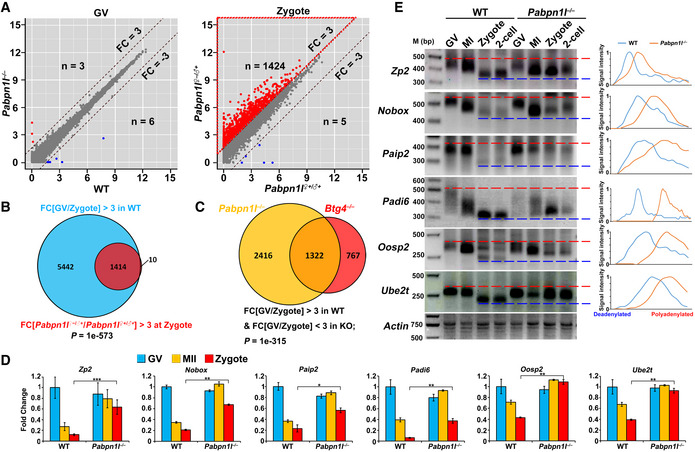
Scatter plot comparing the transcripts of GV oocytes and zygotes from WT and Pabpn1l
−/− females. Transcripts that increased or decreased by more than 3‐fold in Pabpn1l‐deleted GV oocytes or zygotes are highlighted in red or blue, respectively.
-
B
Venn diagrams showing the overlap in transcripts that are significantly degraded during the MZT (FPKM[GV/zygote] > 3) of WT oocytes and transcripts that are accumulated in this process after Pabpn1l knockout (FPKM[Pabpn1l
♀−/♂+/WT] in zygote) > 3).
-
C
Venn diagrams showing the overlap in transcripts that are stabilized during the MZT in Pabpn1l
♀−/♂+ and Btg4
♀−/♂+ zygotes (FPKM[GV/zygote] > 3 in WT, but < 3 in KO).
-
D
RT–qPCR results for relative expression levels of the indicated maternal transcripts in oocytes and zygotes from WT and Pabpn1l
−/− females. n = 3 biological replicates. Error bars, SEM. *P < 0.05, **P < 0.01, and ***P < 0.001 by two‐tailed Student's t‐test.
-
E
Poly(A) tail assay results showing poly(A)‐tail length of indicated transcripts in WT and Pabpn1l‐deleted oocytes and embryos. The poly(A) tails of Actin are used as an internal control. Each sample was prepared from 100 oocytes or embryos. Plots show the averaged relative signal intensity (y‐axis) and length of the PCR products based on mobility (x‐axis).

