-
A
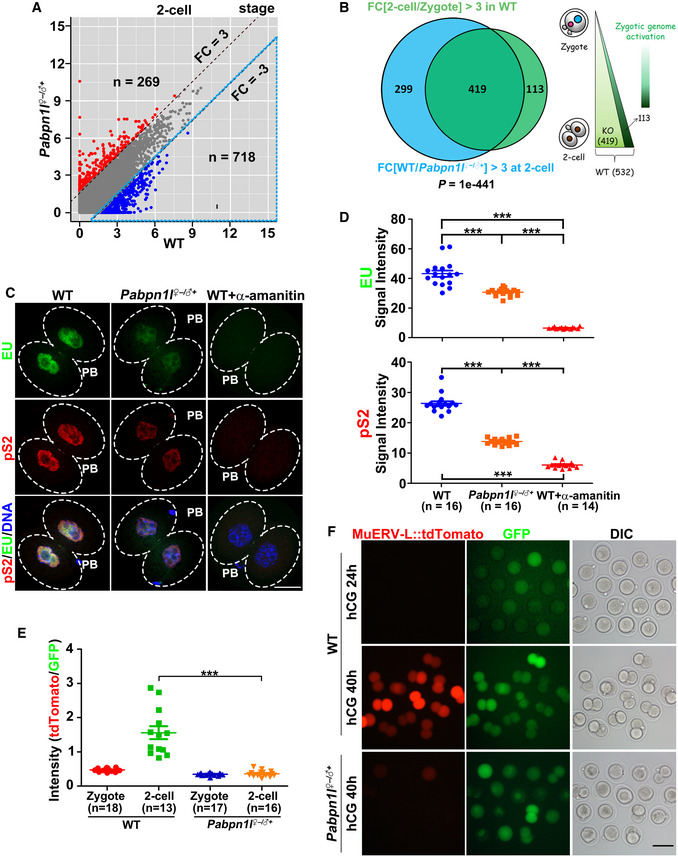
Scatter plot comparing the transcripts of 2‐cell embryos from WT and Pabpn1l
−/− females. Transcripts that increased or decreased by more than 3‐fold in Pabpn1l‐deleted oocytes or embryos are highlighted in red or blue, respectively.
-
B
Venn diagram and schematic showing the overlap in transcripts that are activated during zygote‐to‐2‐cell transition in WT (FPKM[2‐cell/zygote] > 3) and the transcripts that are decreased in Pabpn1l
♀−/♂+ compared to WT at the 2‐cell stage (FPKM[WT/Pabpn1l
♀−/♂+] > 3 in 2‐cell embryos).
-
C
5‐Ethynyl uridine (EU) fluorescence (green) showing RNA transcription in WT and Pabpn1l
♀−/♂+ 2‐cell embryos. Some WT embryos were treated with α‐amanitin as early as the zygote stage and cultured to the 2‐cell stage. The phosphorylated RNA polymerase II CTD repeat YSPTSPS (pS2) (red) is co‐stained to label the RNA polymerase II activity. Nuclei are labeled by DAPI (blue). Scale bar = 20 μm.
-
D
Quantification of EU and pS2 signals in (C). The numbers of analyzed embryos are indicated (n). Error bars, SEM. ***P < 0.001 by two‐tailed Student's t‐test.
-
E
Relative intensity of tdTomato signals in (F). The numbers of analyzed embryos are indicated (n). Error bars, SEM. ***P < 0.001 by two‐tailed Student's t‐test.
-
F
Representative images of MuERV‐L::tdTomato relative to GFP signal in the same embryo when WT embryos reached the corresponding stages. Zygotes were injected with the MuERV‐L::tdTomato reporter plasmid and polyadenylated Gfp mRNA (as a positive control of microinjection), then allowed to develop in vitro. Cultured embryos were imaged at 24 and 40 h after hCG injection. DIC, differential interference contrast. Scale bar = 100 μm.

