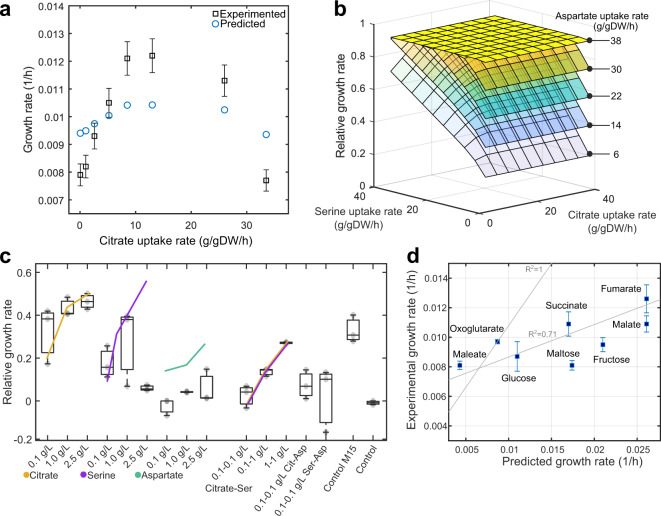
Fig. 2. Validation of the metabolic model of Liberibacter crescens BT-1.
a Simulated growth rate results using the culture medium M15 while varying the citrate concentration (blue circles). Squares with error bars (standard deviation) represent the average growth rate calculated using OD measurements. Citrate constraints used for simulation as well as experimental and predicted growth rates are given in Supplementary Table 3. Increase in the growth rate at citrate uptake rates higher than 10 g/gDW/h was associated with an increase of alanine uptake rate. b Relative growth rate predictions across varying citrate, serine, and aspartate uptake rates. Growth rate in M15 was used as control c Experimentally determined growth phenotypes. Box plots show L. crescens BT-1 average growth under 14 treatments using several concentrations of citrate, serine, and aspartate and their interaction, the central mark indicates the media, and the bottom and top edges of the box indicate the 25th and 75th percentiles, respectively. Experiments were carried out using three independent replicates. Growth rates were calculated using 25 consecutive time points (sampled every 12 h) measured over the course of 12 days. The culture medium M15 and the base media (without nutrients) were used as controls. d Comparison among predicted and experimental growth rates of BT-1 while using the culture media M14 (Supplementary Table 3) in combination with glucose, fructose, fumarate, malate, maleate, maltose, oxoglutarate, and succinate as additional carbon sources. Predicted and observed growth phenotypes were correlated up to 71% (Pearson correlation, p-value < 0.0041, n = 3). A theoretical R2 = 1 is also shown in the figure for comparison purposes. Squares represent the average growth and its standard deviation.

