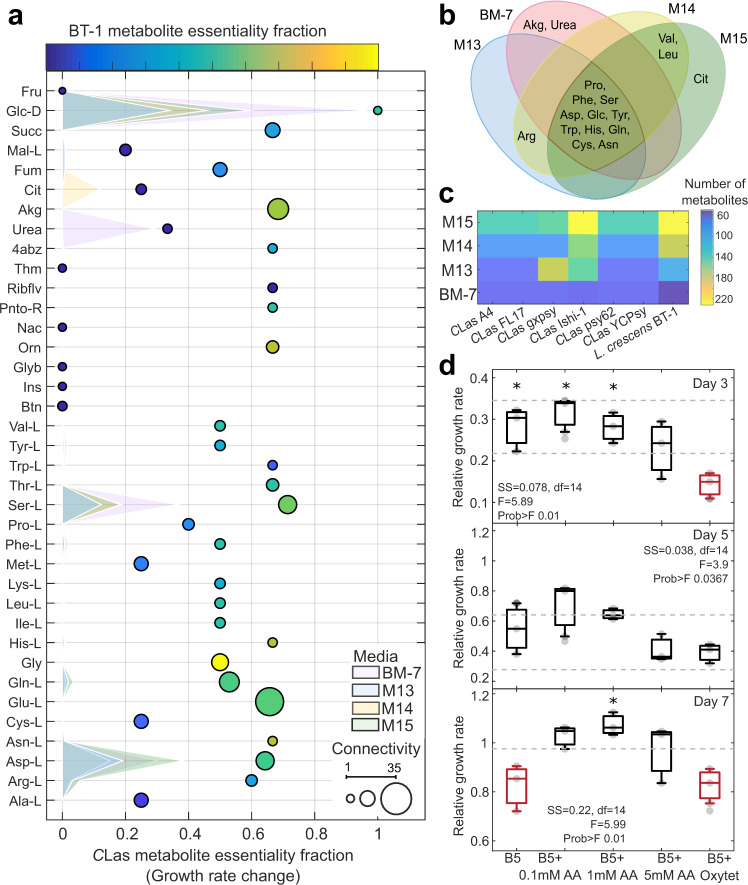
Fig. 3. Model evaluation by culture media.
a Metabolic connectivity and essentiality. The essentiality fraction (change in growth rate) was determined by identifying the percentage of reactions in which each metabolite in the culture media participates. Metabolite essentiality in Candidatus Liberibacter asiaticus strains and Liberibacter crescens BT-1 are shown by bubble location and bubble color (non-essential in dark blue to essential in yellow), respectively. Bubble size indicates connectivity. Shaded surfaces represent the metabolite contribution to the growth rate by culture media. b Metabolites predicted to improve CLas growth rates are compared across media compositions in the Venn diagram. c Biosynthetic capacity under maximal Liberibacter biomass growth rate by culture media. The color scale represents the number of metabolites predicted to be synthesized. d In vitro measurements of CLas growth rates over time in hairy root-assays. Panels show CLas titers for day 3, 5, and 7. Experimental measurements were normalized to one for day 0. Each panel shows the one-way ANOVA for the five assayed treatments (B5, culture medium suitable for the hairy root system; B5 + 0.1 mM AA, the hairy root system using B5 medium in addition with 0.1 mM of a cocktail of glycine, serine, proline, aspartate, glutamate, and glutamine; subsequently the amino acid cocktail was added in concentrations 1 mM and 5 mM for the treatments, B5 + 1 mM AA; B5 and B5 + 5 mM AA; the treatment B5 + Oxytet contained 500 mg/L of the antibiotic oxytetracycline). Measurements were obtained using at least four and maximum five replicates of independent samples, each sample was measured four times (0, 3, 5, and 7 days). The ANOVA function tests the hypothesis that the samples (4–5 total) are drawn from populations with the same mean against the alternative hypothesis that the population means are not all the same. Standard ANOVA stats are given in each panel. Box plots, the central mark indicates the media and the bottom and top edges of the box indicate the 25th and 75th percentiles, respectively, marked with asterisk (*) are significantly different from the red boxplot(s) of the same panel.

