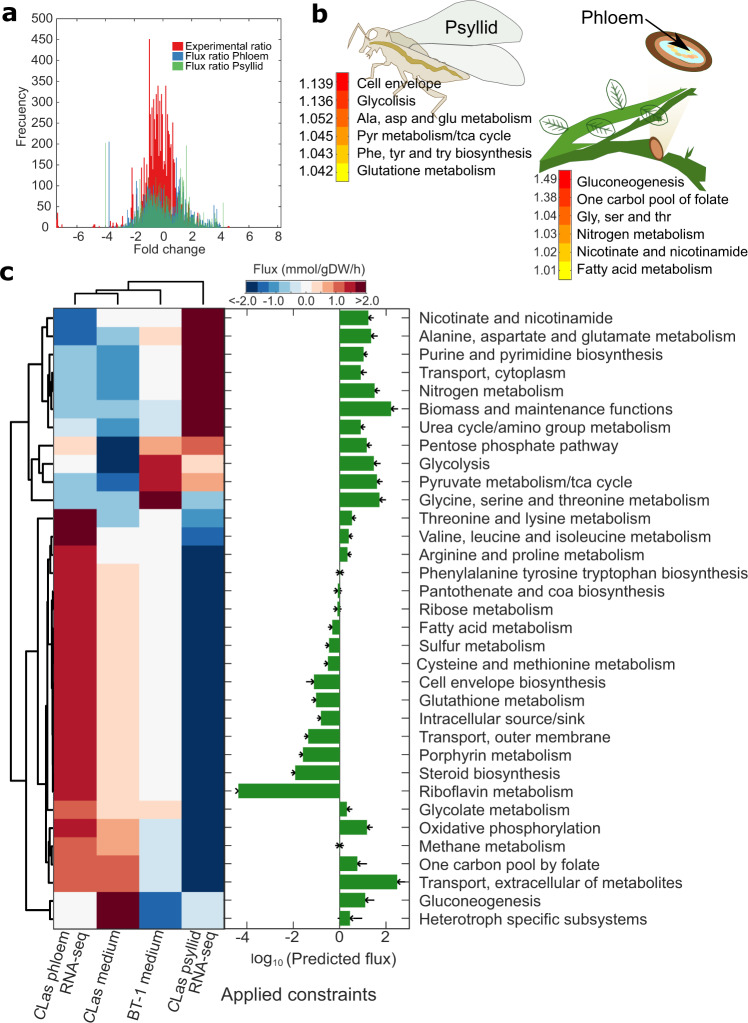
Fig. 4. Model-driven analysis of Candidatus Liberibacter asiaticus (CLas) RNA-sequencing data.
a The histogram shows the distribution of the average fold change of CLas expression for samples obtained from the psyllid alimentary canals and citrus phloem. In red the fold change between phloem and psyllid samples is shown using the entire RNA-sequencing dataset. Plotted in blue and green is the average ratio of predicted flux distribution from the CLas model (A4, FL17, gxpsy, Ishi-1, psy62, and YCPsy) using M15 culture medium and RNA-sequencing data from psyllid and phloem samples, respectively. b Heatmap highlighting CLas subsystems with highest flux activity in psyllid and phloem samples. Numbers represent the fold change increase of predicted flux. c Analysis of predicted flux distributions from constraining the CLas models with RNA-sequencing data (phloem and psyllid), or culture medium M15 (Medium) compared to the predicted flux distribution for L. crescens BT-1 using M15 medium. Barplot shows the total flux carried by pathway by all the simulated flux distributions for all CLas and L. crescens strains. Correlation matrix shows that flux distribution clusters by constraint conditions independently of CLas strain (Supplementary Fig. 6), enabling to averaging of the flux distribution by strain.

